Look, if you’re still guessing what’s working on Instagram, you’re throwing money at the wall and hoping it sticks.
Most people “post and pray,” but that’s a great way to go broke. You need data. You need to know what’s actually moving the needle.
That’s why I’ve put together this comparison of the best Instagram analytics tools. You can use these tools to uncover actual insights you can use to grow on Instagram.
Let’s get into it.
TL;DR:
- Social Status – Best overall Instagram analytics and reporting tool.
- Pallyy – Best Instagram analytics tool for affordability. Includes bio link tool, scheduling, inbox, and a free plan.
- Sendible – Best all-in-one social media tool with Instagram analytics.
- Iconosquare – Industry-leading Instagram marketing tool with publishing, analytics, and more. Includes functionality for other networks.
#1 – Social Status
Social Status is my top pick. It’s one of the only dedicated social analytics tools on the market, so it offers much deeper insights than you get with other all-in-one apps.
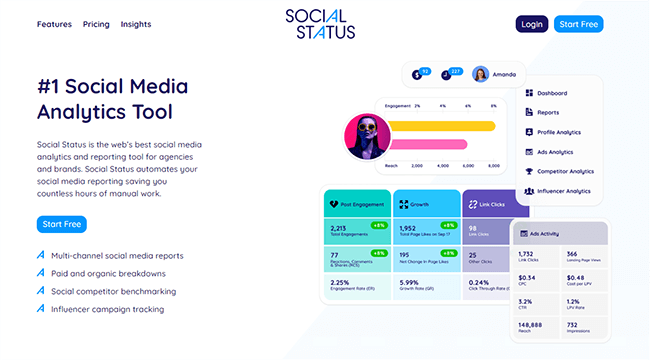
Social Status sorts its analytics into four different reports: Profile Analytics, Ads Analytics, Competitor Analytics, and Influencer Analytics.
I found the Profile Analytics report to be the most useful. It provides all the metrics you could need to analyze your Instagram account, posts, Reels, and Stories (as well as all your other social media posts and pages across different networks).
You can track things like organic reach rate (ORR), impressions, replies, taps back/forward, and link clicks. Plus, learn more about your followers with audience demographic data that tell you their gender, ages, countries, etc.
The Ads Analytics report is great too. A lot of other Instagram analytics tools focus exclusively on organic performance, so it’s nice that you can get insights into both your organic and paid campaigns in one place with Social Status.
And let’s not forget about its excellent Report Builder. Use it to create, automate, and deliver custom, multi-channel, white-label reports to your clients. You get to choose exactly the data you want to show, and you can export reports in various formats including CSV, PDF, and PPTX.
Pros and cons
Pricing
Free plan available. Paid plans start from $9/month, and save 3 months with yearly billing. Get started with a 14-day free trial.
#2 – Pallyy
Pallyy is one of the more affordable Instagram analytics tools out there. It has a great free plan and I like its slick, stylish user interface.
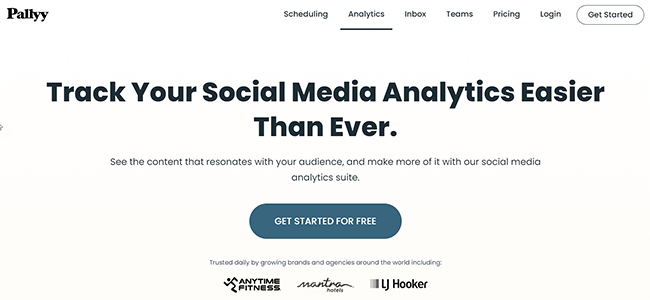
You can see Pallyy was built with creators in mind. It’s super easy to use and provides the kind of data influencers need to measure their growth & performance, and better understand their audience.
In the analytics dashboard, you’ll find stats about your Instagram profile, posts, stories, and competitors. Plus, you can also use it to analyze your performance on other networks like Facebook and LinkedIn.
I particularly like the fact that Pallyy tells you your best time to post, based on when your audience is most active. This can help you to optimize your schedule and get more views and engagements.
And the report builder is one of my personal favorites. It’s much easier to use than most other report builders I’ve tried—you just choose your metrics and reporting period, then generate and export it.
Unfortunately, though, I couldn’t see any way to schedule/automate reports. It looks like you have to do it manually each time, which is a bit disappointing.
Aside from analytics, Pallyy also gives you other useful Instagram tools including a bio link builder, scheduling/publishing tools, unified inbox, team collaboration features, and more.
While Pallyy’s premium plan is super affordable for individual users, you have to pay an extra $10/month per additional user, which makes it not so good for teams.
Pros and cons
Pricing
Premium plans from $15/month per social set. Get started with a 14-day free trial.
Read our Pallyy review.
#3 – Sendible
Sendible is my favorite all-in-one tool. You don’t just get Instagram analytics, but also tools to help you schedule social media posts, manage comments and replies, curate content, and more.

You get a lot of data with Sendible. All in all, there are over 200+ analytics modules, which is more than most other tools I’ve tried.
Analytics modules include metrics, graphs, and visualizations of things like your reach, post engagements, follower growth, etc. Plus, insights into your best times to post, best-performing posts, follower demographics, and more.
You can mix and match analytics modules in the report builder to create fully custom reports. Alternatively, start from a pre-built template. If you want, you can even combine your Instagram analytics with your other social media profiles and pages for cross-channel reports.
And I haven’t mentioned my favorite thing about Sendible yet, which is the fact that it’s fully white label. That means you can add your branding to the app and host it on your website. Then, onboard clients and have them connect their socials like it’s your own in-house software.
I haven’t seen any other Instagram analytics tool that can do this. It’s exclusive to Sendible, which makes it a great choice for marketing agencies.
Pros and cons
Pricing
Plans start from $29/month, save 15% with yearly billing. Get started with a 14-day free trial.
Read our Sendible review.
#4 – Iconosquare
Iconosquare is one of the most powerful Instagram analytics tools on the market. It offers industry-leading analytics, publishing, and more. In addition to Instagram, it also supports other networks.
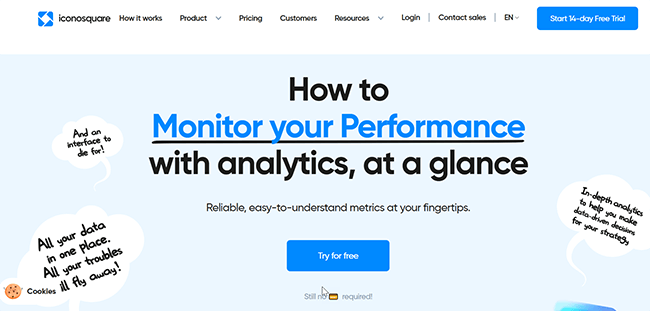
You can track over 100+ metrics with Iconosquare, including stats about your reach, engagement, audience, and follower growth. All metrics can be turned into data visualizations (i.e. graphs and charts) in one click.
My favorite feature is the customizable dashboard. It lets you choose what widgets you want to display and rearrange them in whatever order you want. The result is a personalized page that shows you all the statistics and metrics you’re most interested in, with none of the noise.
I also like the fact that Iconosquare sends reports automatically straight to your inbox (or your client’s inbox), so you don’t have to manually build them each week/month/quarter/year.
Another cool feature: Iconosquare offers social listening, which means it can track and analyze mentions of specified keywords, hashtags, competitors, etc. across Instagram and beyond. And it can pull in data about those mentions into your reports.
Pros and cons
Pricing
Paid plans start from $59/month and save up to 22% with annual billing. Get started with a 14-day free trial.
Read our Iconosquare review.
#5 – Viraly
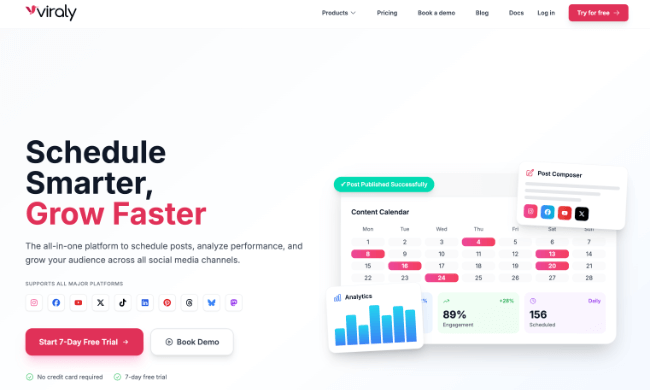
Viraly started out as a post scheduler but has since added a suite of analytics tools. They offer both post and profile analytics for Instagram.
Just connect your Instagram account to get detailed insights into your performance and audience.
You get all the basic stats. Likes, follows, views, comments, shares, etc. Plus some deeper insights that you don’t get with Instagram’s native analytics feature.
For instance, Viraly doesn’t just tell you how many likes and shares you’ve had, it also displays graphs to show you how those engagements are distributed across different types of Instagram posts (Reels, Ads, Carousels, Stories, etc.).
You’ll also be able to see who your posts are reaching and engaging with, with a breakdown of your top audience demographics (countries, cities, gender, age, etc.), and plenty of other useful insights.
Aside from analytics, you can also use Viraly to schedule and auto-publish posts to multiple social networks from one unified content calendar. I like the calendar UI a lot—it’s very simple and easy to work with.
Another thing I like about Viraly is that it lets you organize your connected accounts into social sets, and keep social sets siloed in separate workspaces. If you’re a social media manager or agency that works with multiple brands, you’ll find this useful.
Pros and cons
Pricing
Free plan available. Plans start at $19 per month, with discounts available if you choose to pay yearly.
#6 – Agorapulse
Agorapulse offers a lot of metrics you don’t get with other Instagram analytics tools.

For example, it’s one of the only tools I’ve tried that can measure the ROI of your Instagram efforts in actual dollars and cents, making it a good choice for social media managers who want to show their brands the impact they’re having on their bottom line.
Its reports are super detailed too. Depending on what you want to analyze, you can pull up reports on your Instagram audience, content, stories, community management, etc. in a couple of clicks.
Each of those reports comes with a wealth of data, including all the metrics you’d expect to see (like engagement rates, follower growth, impressions, audience demographics, etc.) plus lots of deeper insights.
I particularly like the fact that Agorapulse pulls data from its social listening tool into your reports to serve up metrics like your ‘brand awareness score’ (which is based on the number of mentions and shares you get in the chosen period).
Aside from Instagram analytics, Agorapulse also offers reports for all your other social media profiles and pages. Plus, tools for social media publishing, inbox management, listening, employee advocacy, and more.
It has some pretty fantastic team collaboration features too. And you can even analyze each team member’s performance in Agorapulse (replies sent, tasks completed, etc.) alongside your Instagram analytics. All that being said, it’s a little pricey for teams as you pay per user.
Pros and cons
Pricing
Paid plans start from $69 per user, per month. Get up to 30% off when you pay yearly, and try it out with a 30-day free trial.
Read our Agorapulse review.
#7 – Metricool
Metricool is an industry-leading Instagram analytics tool. Like other tools, it supports other networks and offers more social media-related features beyond Instagram analytics. There’s also a free plan.
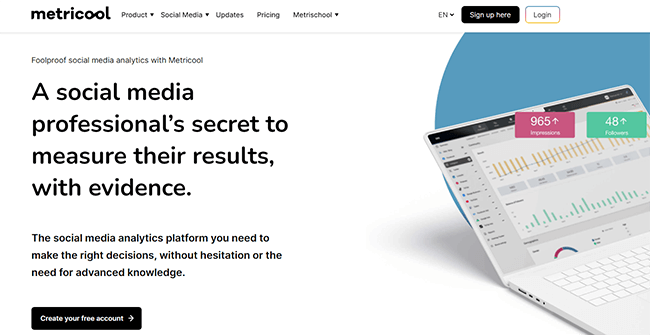
The Instagram analytics in Metricool are extremely detailed. You get access to highly visual data that provides insights into the growth of your Instagram audience, demographic information, account performance, and more.
You can also view detailed metrics that cover the performance of your posts. We’re talking metrics like engagement, impressions, likes, comments, saves, etc. And, those engagement metrics are super important for the Instagram algorithm!
There are overviews so you can see performance at a glance, and in-depth views that show you how each post performs. With additional analytics for Instagram Stories and Reels.
But that’s not all. There’s a report builder that allows you to pull in your Instagram analytics data and combine it with data from other social networks. The result? A report that will impress your clients. You can also export reports as PDF or PPT files.
Brands and creators running events will appreciate the hashtag tracking feature. This is a paid add-on but it’s extremely powerful.
In addition, you’ll find an Instagram bio link tool, and Instagram scheduling capabilities. When scheduling posts on the calendar, analytics from your accounts will be used to provide best times to post on Instagram and other social networks.
Pros and cons
Pricing
Free plan available. Paid plans start from $22/month and save up to 20% with yearly billing.
Read our Metricool review.
#8 – Brand24
Brand24 is great for finding out who’s talking about your brand on Instagram, as well as measuring overall brand awareness and sentiment.

It’s a dedicated web monitoring tool, which means it ‘listens out’ for mentions of any keywords you want to track across the web, including on Instagram, and lets you know about them.
Plus, it also analyzes the context of those mentions to provide deeper insights. For example, it can detect whether a mention is positive, negative, or neutral, and use that data to measure your brand sentiment.
One way I like to use Brand24 specifically for Instagram is to find influencers. It tells you the most popular posts and profiles that mention your target keywords, and assigns each profile an ‘influencer score’, making it easy to find the influencers that are having the biggest impact.
You could also use it to track topics and discover trends, monitor your competitors, and analyze the impact your Instagram efforts are having on brand awareness.
Just keep in mind that Brand24 doesn’t provide other, more general Instagram analytics, like information about the performance of your posts and your follower growth. It’s just for mentions.
Pros and cons
Pricing
Plans start from $149/month, save 2+ months with yearly billing. Get started with a 14-day free trial.
Read our Brand24 review.
#9 – HopperHQ
HopperHQ offers excellent value for larger teams as it’s one of the only tools that lets you add unlimited users without paying extra. There’s just one plan, and it includes everything (all features, unlimited posts, unlimited users).

HopperHQ isn’t just an Instagram analytics tool. It’s a pretty well-rounded social media toolkit as it also offers other features like post scheduling, link in bio, and hashtag research.
Its analytics dashboard offers insights into your audience, account performance, and content performance.
From the Audience tab, you’ll be able to see a breakdown of the countries/locations your followers are in, what ages they are, when they’re most active, and other useful insights to help guide your strategy.
The Account Performance tab offers graphs, charts, and visualizations to show you your reach, impressions, views, website clicks, and followers gained/lost over time.
And on the Content Performance dashboard, you can see at a glance which of your content is performing the best. Metrics tell you each post’s reach, engagements, engagement rate, etc.
Another feature I like is HopperHQ’s Hashtag Research tool. Use it to discover, generate, and analyze hashtags to boost your reach.
Metrics tell you how many daily posts on Instagram use each hashtag, how many comments/likes they get, how competitive they are (from very low to extreme), and more. This all helps you to identify the best hashtags that’ll help you to get more eyes on your posts.
Pros and cons
Pricing
Plans start from $19 per month, per social set. Save money with annual billing. Get started for free with a 14-day trial.
#10 – SocialBlade
SocialBlade is a useful free social media analytics tool that provides basic statistics for Instagram, as well as YouTube, twitch, Twitter, and more.

I like how easy SocialBlade is to use. You don’t even need to sign up and log in to get started.
You just load up the site, then enter the @username of the Instagram profile you want to analyze in the search box and hit search.
It’ll load up a report with lots of Instagram statistics. Under the User Summary page, you can see top-level metrics like followers/following, average engagement rate, likes, comments, followers gained, rank, etc.
And if you switch over to the Detailed Statistics tab, you’ll see a more thorough breakdown with graphs to illustrate follower growth and media shares over time.
You don’t get the more advanced insights you do with other tools, like ‘best time to post’ recommendations and such. And I find the user interface super frustrating—it’s riddled with pop-up ads and banner ads.
But if you just want basic Instagram analytics and you don’t want to invest in a paid solution, it’s worth checking out.
Pros and cons
Pricing
Free plan available. Paid plans start from $3.99/month and you can save 2 months when you pay yearly.
#11 – Instagram Insights
Instagram Insights is the native analytics you can access from within the IG app. It’s free to use if you have a Business or Creator account and provides basic performance and audience statistics that you can feed back into your Instagram marketing strategy.

My main complaint with Instagram Insights is that you can only look back over 90 days of analytics data. So if you’re trying to track long-term trends and compare performance and growth year over year, you’re out of luck.
Plus, you can only view analytics within the app. You can’t build and export reports like you can with premium Instagram analytics tools. That’s probably going to be a deal-breaker if you need to share insights externally with your clients.
That said, if you just want to view basic metrics and insights like total accounts reached and engaged, total reel plays, follower demographics, etc. and you don’t need any of the other bells and whistles, it does the job.
Pros and cons
Pricing
Instagram Insights is free to use.
#12 – Sprout Social
Sprout Social is one of the most expensive Instagram analytics apps I’ve tried. The starting price will doubt be too high for most users, but it could be a good choice for brands and agencies that have a bigger budget to work with.
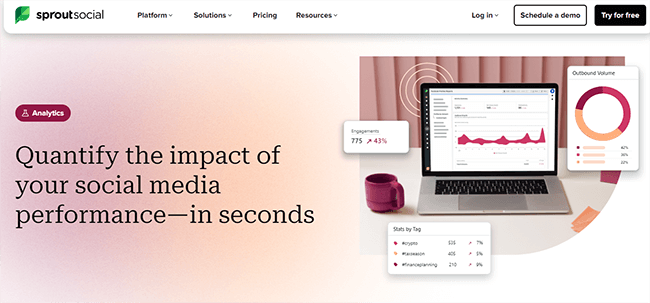
Sprout is designed to be an all-in-one social media management tool with everything you need to manage your whole social media presence in one place.
So, it’s not just for Instagram analytics. You also get a bunch of other tools for things like Instagram scheduling, inbox management, social listening, employee advocacy, influencer marketing, etc. And you can connect all your profiles and pages from different social networks.
Its analytics are impressive too. You get deeper insights than most other tools with all the statistics you could want about your Instagram profile, posts, audience, competitors, hashtags, ads, etc. I particularly like the way it tells you the best time to post on Instagram for maximum reach/engagement.
You also have the option of paying extra for Sprout’s Premium Analytics. This will give you access to 150+ more metrics, as well as interactive data visualizations and the report builder.
Pros and cons
Pricing
Plans start from $249/seat/month and save up to 25% with yearly billing. Get started with a 30-day free trial.
Final thoughts
Listen, you’ve got the full breakdown. Now you’ve got a choice. You can keep “winging it” and wonder why your engagement is tanking, or you can pick one of these tools and finally start making data-backed moves.
The reality is the Instagram algorithm isn’t waiting for you to catch up.
Every post you put out without knowing the numbers is just a shot in the dark. Don’t let your competitors walk away with your customers just because they have better intel than you do.
The longer you wait to track your results, the further you’ll fall behind your competitors. Grab your favorite from this list of the best Instagram analytics tools and start digging into the data.
Not sure which to choose? You can’t go wrong with any of our top picks. And each tool offers a free trial or free plan so you can get started right away.
You can find more options in our roundup of the best social media reporting tools. You might also like these Instagram tools and bio link tools.
Hoping to monetize your audience on Instagram? Learn how to get more followers here, and find out how many Instagram followers you need to start making money.
Disclosure: Our content is reader-supported. If you click on certain links we may make a commission.