32 Facebook Statistics For 2024 (Users, Market Share, Growth)
Curious about the latest Facebook statistics?
Facebook is one of the world’s most popular social media platforms, but some claim it’s a dying network only used by older generations.
We gathered statistics from studies around the web to investigate this claim and to see where Facebook stands in the world of social media and social media marketing.
Editor’s top picks – Facebook statistics
Here are the top Facebook stats in this post:
- Facebook has a 66.23% market share worldwide among leading social media platforms. (StatCounter)
- Facebook’s parent company, Meta, earned $134.9 billion in revenue in 2023. (Meta)
- 64.79% of web traffic referrals originate from Facebook. (We Are Social)
- Facebook has an average daily user count of 2.11 billion. (Meta)
- Facebook ads have an average click-through rate of 2.5%. (Wordstream)
General Facebook statistics
1. Facebook has a global market share of 66.23%
According to data collected by StatCounter, Facebook has a global market share of 66.23% among major social media sites.
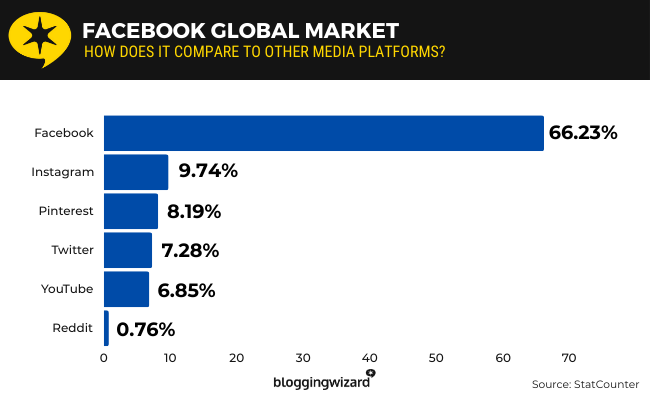
Here’s how it compares to other social media platforms:
- Facebook – This platform has a global market share of 66.23%
- Instagram – 9.74%
- Pinterest – 8.19%
- (X) Twitter – 7.28%
- YouTube – 6.85%
- Reddit – 0.76%
This figure is similar on mobile devices.
However, on desktop, Facebook’s global market share drops to 42.87% while Pinterest comes in at 19.57%, YouTube at 14.06% and X (Twitter) at 12.54%.
Source: StatCounter
2. Meta earned $134.9 billion in revenue in 2023
Facebook’s parent company, Meta, earned $134,902 million in revenue in 2023, which translates into $134.9 billion.
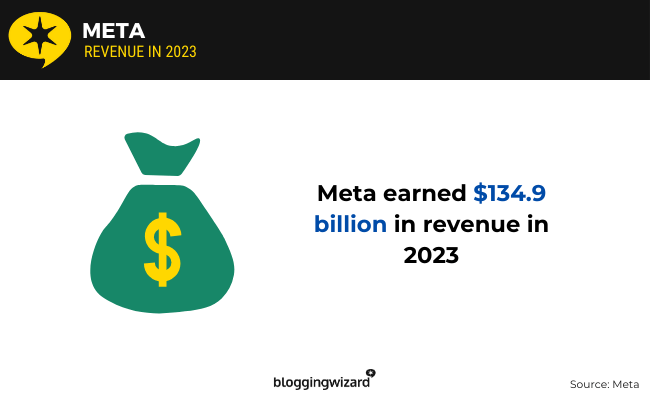
Meta owns Facebook, Instagram, Facebook Messenger, Threads and WhatsApp.
The company’s financial report for 2023 includes a breakdown of Meta’s revenue.
$131,948 million, or $132 billion, of that revenue came from advertising alone. This means 97.81% of Meta’s revenue depends on ads that run on social media platforms like Facebook and Instagram.
Unfortunately, the company did not list how much of that revenue came from each individual app.
$1,058 million, or $1.1 billion, of revenue is listed as “other.”
Meta’s revenue was $116.61 billion in 2022. This means the company’s revenue grew by 15.68% between 2022 and 2023.
Source: Meta
3. 57.3% of internet users around the world are Facebook users
According to data collected by We Are Social and published by Startup Bonsai, 57.3% of all internet users around the globe use Facebook.
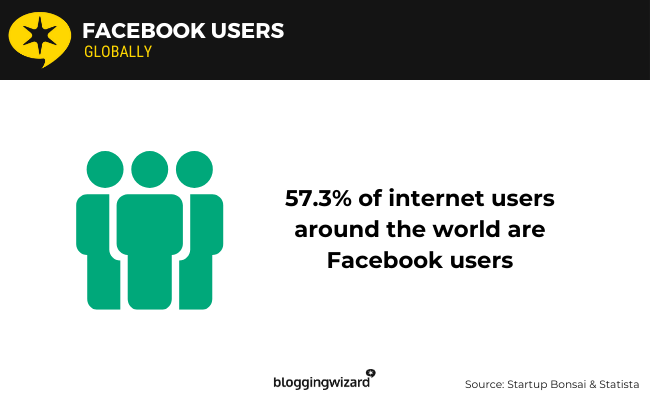
To put this into context, there are 5.35 billion internet users and 5.04 billion social media users around the world.
This means around 3.07 billion internet users are Facebook users.
Source: Startup Bonsai1, Statista1
4. There will be 262.8 million Facebook users in the United States by 2028
Data collected and shared by Statista states that there were 246.73 million Facebook users in the United States in 2023.
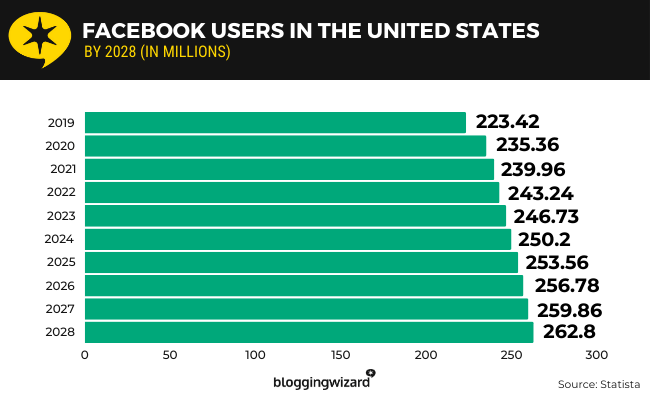
Based on current trajectories, Facebook’s user base is expected to grow to 262.8 million users by 2028.
This means Facebook’s user base in the United States will grow by 6.51% between now and 2028.
Source: Statista2
5. 64.79% of all web traffic referrals come from Facebook alone
In We Are Social’s latest report on internet and social media use, they analyzed web traffic referrals across all devices.
When referrals occur from social media platforms, the vast majority of those referrals, or 64.79%, come from Facebook alone.
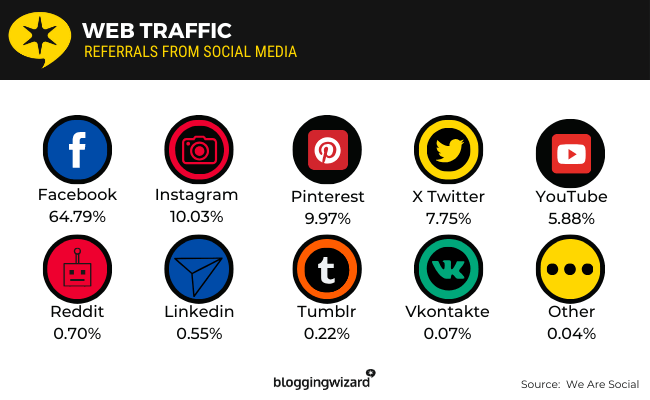
The next biggest source for referrals is Instagram at 10.03%.
Source: We Are Social
6. 12.8% of internet users say Facebook is their favorite social media platform
In We Are Social’s report, the company asked respondents about their favorite social media platforms.
While 16.5% said Instagram and 16.1% said WhatsApp, 12.8% said Facebook was their favorite platform.
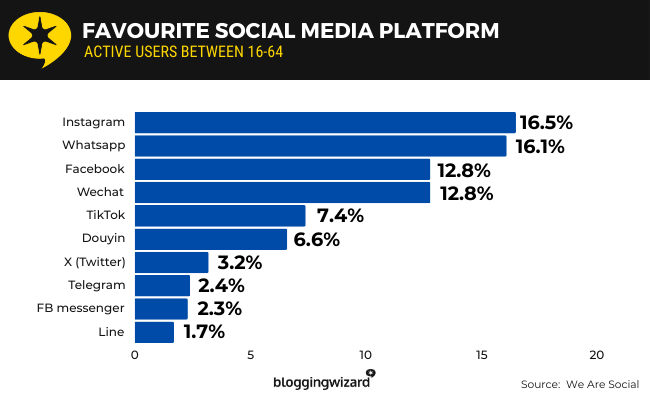
WeChat also received 12.8% of votes, but more surprisingly, this poll put Facebook ahead of TikTok, which received 7.4% of votes.
Facebook Messenger received 2.3% of votes:
- Instagram – 16.5% of internet users say Instagram is their favorite social media platform
- WhatsApp – 16.1%
- Facebook – 12.8%
- WeChat – 12.8%
- TikTok – 7.4%
- Douyin – 6.6%
- X (Twitter) – 3.2%
- Telegram – 2.4%
- Facebook Messenger – 2.3%
- Line – 1.7%
- Kuaishou – 1.6%
- Pinterest – 1.5%
- Snapchat – 1.3%
- QQ – 0.9%
- Xiaohongshu – 0.9%
Source: We Are Social
7. The average engagement rate of a Facebook post is 9.66%
The average Facebook post has an engagement rate of 9.66%.
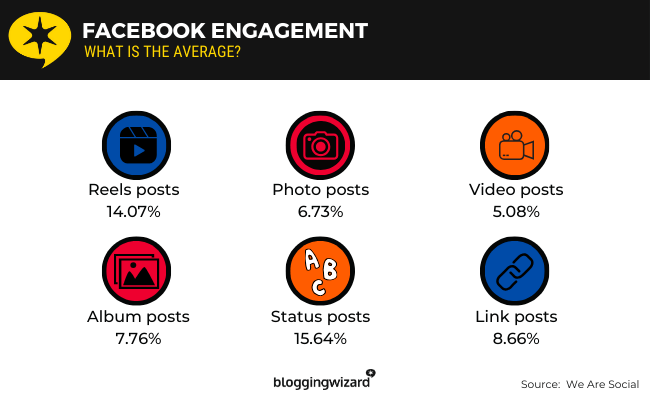
Status posts have the highest engagement rate at 15.64%.
Next are reels at 14.07%, then link posts at 8.66%.
Album posts have an average engagement rate of 7.76% while video posts have an average engagement rate of 5.08%.
These are all useful averages to use when setting expectations for your Facebook marketing strategy.
Source: We Are Social
8. 54.3% of Facebook users conduct brand research on the platform
We Are Social’s report states that around 73.9% of internet users use social media for brand research.
Of that 73.9%, 54.3% use Facebook to conduct brand research.
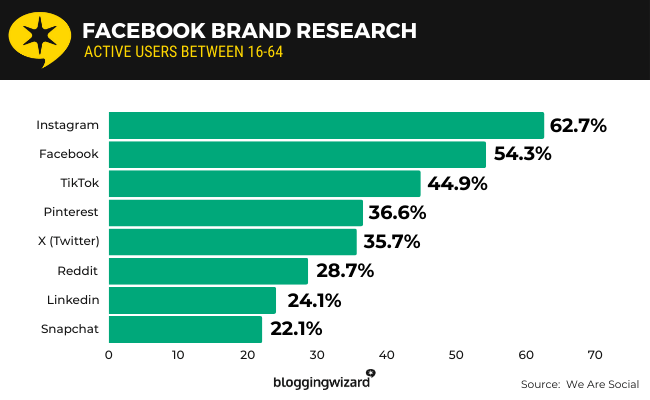
This put it in second place among eight platforms:
- Instagram – 62.7% of internet users use this social media platform for brand research
- Facebook – 54.3%
- TikTok – 44.9%
- Pinterest – 36.6%
- X (Twitter) – 35.7%
- Reddit – 28.7%
- LinkedIn – 24.1%
- Snapchat – 22.1%
83.1% of respondents voted for the “any of these 8 platforms” option.
Source: We Are Social
9. Cristiano Ronaldo is the most followed Facebook page at 168 million followers
Besides the Facebook page for the Facebook App itself, which has 188 million followers, Cristiano Ronaldo is the most followed Facebook page with 168 million followers.
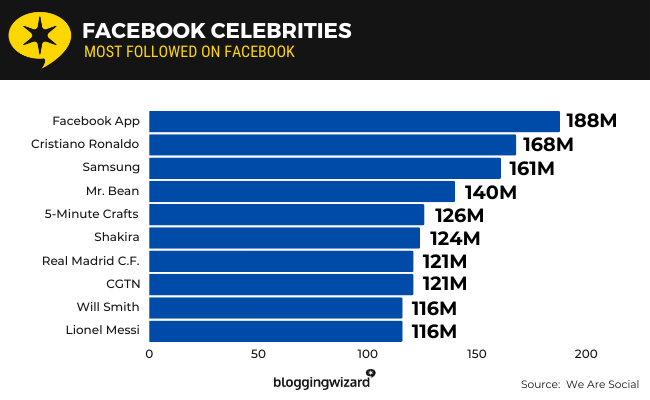
Here are the top 10 most followed Facebook pages, excluding the Facebook App page:
- Cristiano Ronaldo – 168 million followers
- Samsung – 161 million followers
- Mr. Bean – 140 million followers
- 5-Minute Crafts – 126 million followers
- Shakira – 124 million followers
- Real Madrid C.F. – 121 million followers
- CGTN – 121 million followers
- Will Smith – 116 million followers
- Lionel Messi – 116 million followers
- FC Barcelona – 113 million followers
Source: We Are Social
10. Facebook and Instagram users have raised over $5 billion on the platform
Facebook launched its fundraising feature in 2016, a feature that’s also available on Instagram.
Since then, Facebook users have raised over $5 billion on the platform.
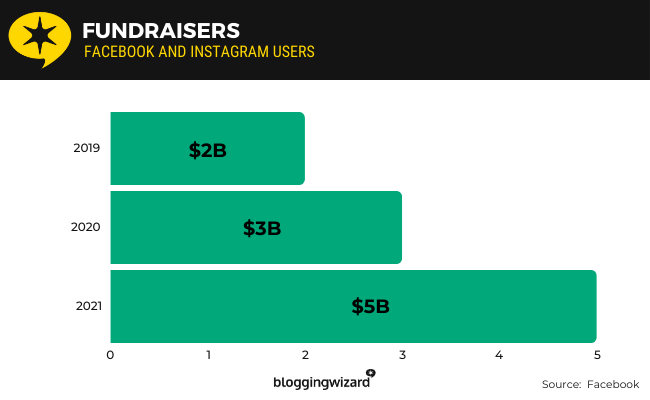
First, it hit the $2 billion milestone in 2019, the $3 billion milestone in 2020 and finally the $5 billion milestone in 2021.
Common fundraising categories include children’s health and mental health, equality and civil justice, environmental causes, and humanitarian and environmental crises.
Source: Facebook
Facebook usage statistics
11. Facebook has 2.11 billion daily active users
In Meta’s financial report for 2023, the company stated that Facebook had 2.11 billion daily active users (DAUs) in 2023.
This was an increase of 6% year over year.
They also had 3.07 billion monthly active users (MAUs).
This was an increase in monthly active Facebook users by 3% year over year.
Source: Meta
12. Facebook.com receives 16.46 billion visits per month
According to website performance collected by Similarweb, Facebook receives an average of 16.46 billion visits per month.
It received 16.71 billion visits in October of 2023, 16.08 billion in November and 16.6 billion in December.
It’s the third-most visited website in the world after Google.com and YouTube.com, according to Semrush.
Source: Similarweb, Semrush
13. Facebook users spend an average of 19 hours and 47 minutes on the platform every month
According to We Are Social’s report, Facebook is the third-most popular social media platform in terms of time spent on the platform.
The average Facebook user spends an average of 19 hours and 47 minutes on this platform per month.
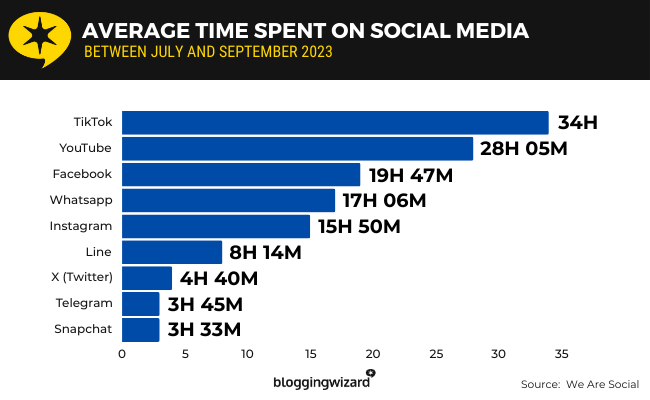
The winner was TikTok with 34 hours. YouTube came in second with 28 hours and 5 minutes.
Here are the full results:
- TikTok – Users spend an average of 34 hours on this platform every month
- YouTube – 28 hours and 5 minutes
- Facebook – 19 hours and 47 minutes
- WhatsApp – 17 hours and 6 minutes
- Instagram – 15 hours and 50 minutes
- Line – 8 hours and 14 minutes
- X (Twitter) – 4 hours and 40 minutes
- Telegram – 3 hours and 45 minutes
- Snapchat – 3 hours and 33 minutes
- Facebook Messenger – 3 hours and 21 minutes
- Pinterest – 1 hour and 49 minutes
- LinkedIn – 51 minutes
The United States spends an average of 17 hours and 19 minutes on Facebook each month while the United Kingdom spends 16 hours and 45 minutes.
Egypt spends the most time on Facebook at 33 hours and 59 minutes per month on average.
Japan spends the least amount of time on Facebook at three hours and 56 minutes per month on average.
Russia is at the bottom of the list with one hour and 54 minutes spent per month on Facebook, but the country blocked access to Facebook and Instagram in 2022.
Source: We Are Social
14. Facebook pages publish an average of 1.88 posts per day
This data comes from Locowise but was published in We Are Social’s report.
The report states that Facebook pages publish an average of 1.88 posts per day.
45.9% of those posts are link posts while 32.7% are photo posts.
18.6% are video posts while 2.8% are status posts.
1.88 posts per day is a low amount but this data may not come as a surprise.
When it comes to publishing posts to social networks, the general consensus has always been that you shouldn’t publish too excessively on Facebook. Whereas you can publish more frequently to platforms like X and Instagram.
This is something to consider when loading posts into your social media scheduler. Still, it’s worth experimenting with posting frequency.
Source: We Are Social
15. Facebook.com has a bounce rate of 57.41%
Semrush’s data on Facebook’s website performance states that the site’s bounce rate is 57.41%.
Users browse 2.49 pages per visit on average and stay on the site for an average 30 minutes and 33 seconds per visit.
Source: Semrush
16. The Facebook app has over 5 billion downloads on Google Play
Google Play lists Facebook’s Android app at over 5 billion downloads.
It has a user rating of 3.6 stars from 139 million reviews.
The app is #10 among all free apps on Google Play.
The app is #3 in the App Store’s Social Networking category. It’s behind Threads and WhatsApp. It’s #14 among all free iOS apps.
The iOS version of the app has a rating of 4.2 stars from 8.2 million reviews.
Source: Google Play, App Store
17. Facebook was the most-downloaded app in the 2010s
This data comes from App Annie but was published by Startup Bonsai.
Facebook’s family of apps were the four most-downloaded apps between 2010 and 2019.
In first was Facebook, second was Facebook Messenger, third was WhatsApp and fourth was Instagram.
Here’s the full top 10 list from App Annie:
- Facebook Messenger
- WhatsApp Messenger
- Snapchat
- Skype
- TikTok
- UC Browser
- YouTube
Source: Startup Bonsai2
18. Facebook users open the Facebook app an average of 320.3 times per month
We Are Social’s report included data on how many sessions each app has from Android users per month.
While WhatsApp is the clear winner at 929.9 sessions per month, Facebook came in fifth with 320.3.
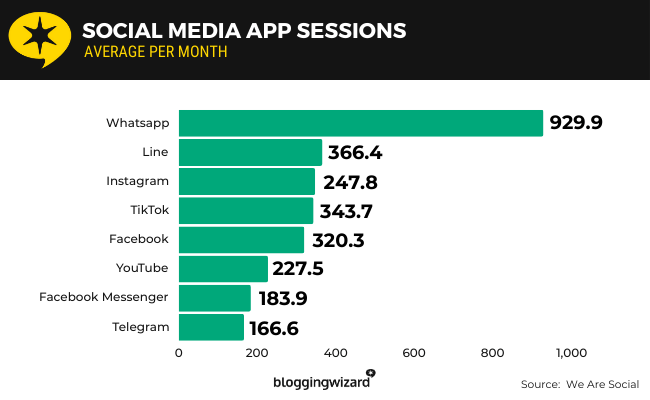
Users spent an average time of three minutes and 42 seconds in the app per session.
This put it in third place with YouTube with seven minutes and 25 seconds per session and TikTok with five minutes and 56 seconds per session.
Source: We Are Social
Facebook advertising statistics
19. The average click-through rate for Facebook ads is 2.5%
According to Wordstream’s latest study on Facebook ads benchmarks, the average click-through rate for a Facebook ad is 2.5%.
Click-through rate is highest in the Arts & Entertainment industry, which has an average click-through rate of 2.55%.
The Dentists & Dental Services category has the lowest click-through rate at 0.81%.
Source: Wordstream
20. The average cost per click for Facebook ads is $1.92
According to Wordstream’s latest study, the average cost per click for a Facebook ad is $1.92.
The Travel industry has the lowest cost per click at $0.43 per click on average.
The Dentists & Dental Services has the highest cost per click at $1.27 on average.
Source: Wordstream
21. The average conversion rate for Facebook ads is 8.25%
According to Wordstream’s latest study on Facebook ads benchmarks, the average conversion rate for a Facebook ad is 8.25%.
Source: Wordstream
22. The average cost per lead for Facebook ads is $23.10
In Wordstream’s latest study on Facebook ads benchmarks, they state that the average cost per lead for a Facebook ad is $23.10.
Source: Wordstream
Facebook demographic statistics
23. 54.03% of Facebook’s user base is male
According to Similarweb’s data on Facebook, 54.03% of the website’s user base is male.
45.97% are female.
Source: Similarweb
24. 28.06% of Facebook’s user base are between the ages of 25 and 34
Similarweb’s data on Facebook puts most Facebook users in the 25 to 34 age demographic.
Here’s how much of Facebook’s user base makes up other demographics:
- 18-24 – 14.41% of Facebook’s user base belongs to this age demographic
- 25-34 – 28.06%
- 35-44 – 20.52%
- 45-54 – 16.15%
- 55-64 – 13.14%
- 65+ – 7.71%
Source: Similarweb
25. 17.65% of adults aged 55 to 64 say Facebook is their favorite social media platform
Although website statistics put Facebook’s user base in a much lower age bracket, surveys suggest that the platform’s most loyal users are between the ages of 55 and 64.
17.65% of adults in this age demographic say Facebook is their favorite social media platform.
This breaks down into 16.9% of female respondents aged 55 to 64 and 18.4% of male respondents.
Here’s how Facebook did among other age demographics:
- 16-24 – 6.9% of respondents in this age demographic say Facebook is their favorite social media platform
- 25-34 – 12.7%
- 35-44 – 14.25%
- 45-54 – 15.5%
- 55-64 – 17.65%
However, the true winners in this poll are as follows:
- 16-24 – 25.85% say Instagram is their favorite social media platform
- 25-34 – 18.8% say Instagram
- 35-44 – 16.5% say WhatsApp
- 45-54 – 18.45% say WhatsApp
- 55-64 – 20.1% say WhatsApp
Source: We Are Social
26. 18.75% of Facebook’s user base is located in the United States
Facebook is an American company. Naturally, the majority of its user base, or 18.75%, are from the United States.
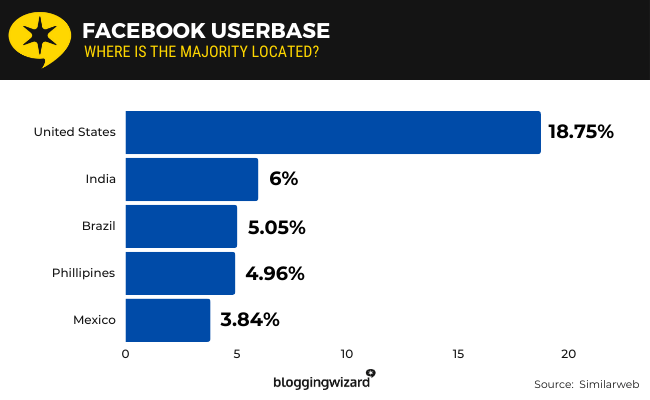
6% are located in India, and 5.05% are located in Brazil.
4.96% are located in the Philippines, and 3.84% are located in Mexico.
Similarweb’s data goes on to report that Facebook is the #3 website in the United States, #4 in India, #4 in Brazil, #2 in the Philippines and #3 in Mexico.
Source: Similarweb
27. India has the largest advertising reach for Facebook with a total reach of 366.85 million users
According to We Are Social’s report, India has the largest total reach for Facebook advertising with a total reach of 366,850,000 users.
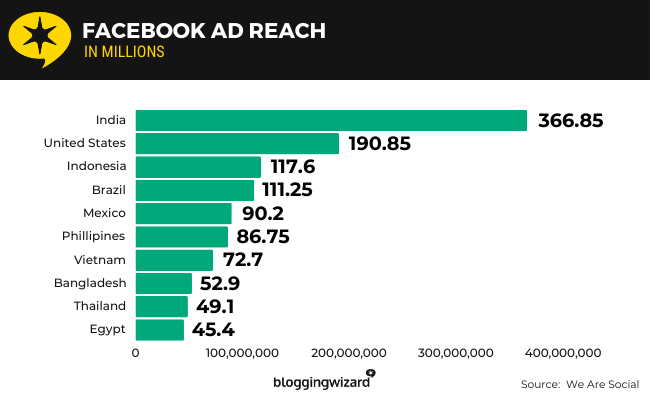
The United States comes in second with a 190,850,000 total reach.
The United Kingdom comes in twelfth with a 37,100,000 total reach.
Source: We Are Social
28. 53.8% of Facebook’s user base speaks English
We Are Social’s report states that the majority of Facebook’s user base, or 53.8%, speaks English. This works out to over 1.15 billion users.
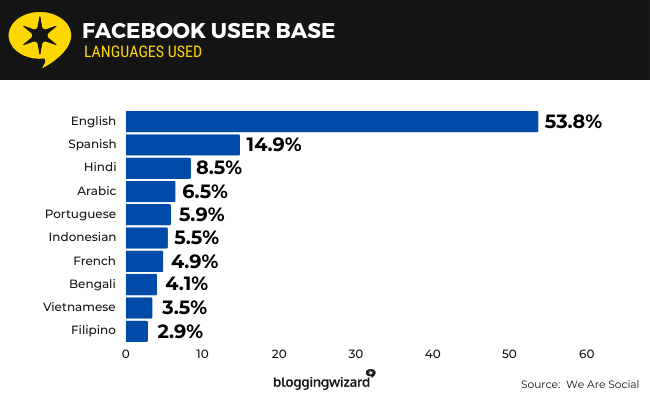
Here are the top 10 languages spoken on Facebook:
- English – 53.8% of Facebook’s user base | 1,150,800 users
- Spanish – 14.9% | 318,400,000 users
- Hindi – 8.5% | 182,700,000 users
- Arabic – 6.5% | 140,050,000 users
- Portuguese – 5.9% | 127,350,000 users
- Indonesian – 5.5% | 117,750,000 users
- French – 4.9% | 104,900,000 users
- Bengali – 4.1% | 88,250,000 users
- Vietnamese – 3.5% | 74,650,000 users
- Filipino – 2.9% | 62,700,000 users
Source: We Are Social
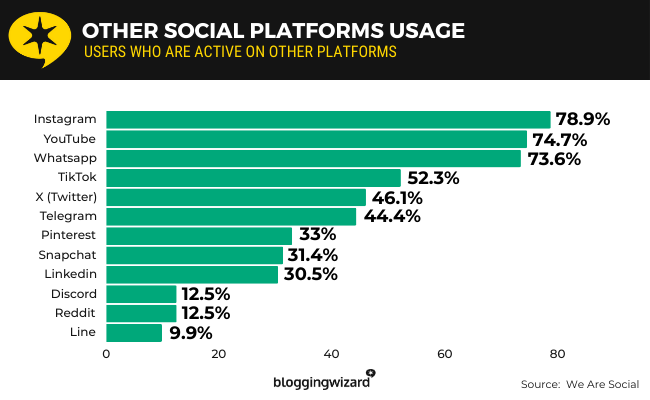
29. 78.9% of Facebook users are also Instagram users
We Are Social collaborates with numerous data companies to produce an annual report about the internet and social media.
In their 2024 report, they discovered that 78.9% of Facebook users also use Instagram.
Here’s how many Facebook users are active on other platforms:
- Instagram – 78.9% of Facebook users also use Instagram
- YouTube – 74.7%
- WhatsApp – 73.6%
- TikTok – 52.3%
- X (Twitter) – 46.1%
- Telegram – 44.4%
- Pinterest – 33%
- Snapchat – 31.4%
- LinkedIn – 30.5%
- Reddit – 12.5%
- Discord – 12.5%
- Line – 9.9%
Source: We Are Social
Facebook video statistics
30. 18.6% of Facebook page posts are video posts
In We Are Social’s report, they state that Facebook pages publish 1.88 posts per day on average.
Of all posts that get published per day, 18.6% are video posts.
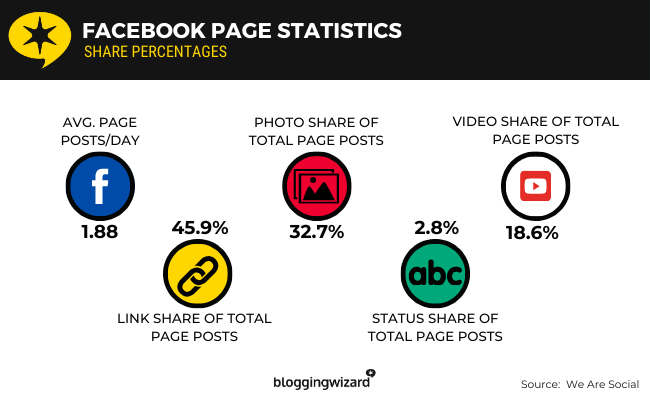
45.9% are link posts, 32.7% are photo posts and 2.8% are status updates.
Source: We Are Social
31. Video posts have an average engagement rate of 5.08%
According to We Are Social, video posts on Facebook have an average engagement rate of 5.08%.
This puts video posts in last place out of all post types.
Source: We Are Social
32. 46% of Facebook users visit Facebook to watch videos
According to data collected by Statista and published by Startup Bonsai, watching videos is the third-most reason Facebook users visit the social media platform.
46% of Facebook users visit the platform to watch videos.
Here are other reasons Facebook users visit Facebook:
- Viewing photos – 65% of Facebook users visit Facebook for this purpose
- Sharing content with everyone – 57%
- Watching videos – 46%
- Sharing content one to one – 43%
- News – 38%
- Networking – 33%
- Finding/shopping for products – 15%
- Promoting a business – 7%
Source: Startup Bonsai3
Sources
- StatCounter
- Meta
- Startup Bonsai1
- Statista1
- Statista2
- We Are Social
- Semrush
- Google Play
- App Store
- Startup Bonsai2
- Wordstream
- Startup Bonsai3
Final thoughts
That rounds out our post on the latest Facebook statistics.
In spite of platforms like YouTube and Instagram remaining strong and newcomers like TikTok taking over with new hot social media features, Facebook remains as a leading social media platform that’s here to stay.
It’s even one of top three websites worldwide.
This means that not only is it a great place for the general population to connect with one another, it’s a great place for marketers to connect with potential customers.
Facebook advertising has a lot of potential, maybe more so than simply publishing content on Facebook alone.
Finally, be sure to check out our posts on Facebook scheduling tools and Facebook analytics tools to find what you need to make the most of this platform.