Are you on the lookout for recent online shopping statistics?
Online shopping statistics demonstrate the state of online shopping and the ecommerce industry as a whole.
In this post, we cover general statistics as well as statistics related to the behaviors and preferences of online shoppers and statistics for retail stores.
Editor’s top picks – online shopping statistics
Here are the top five online shopping statistics in this post:
- The global transaction value for ecommerce is growing at a CAGR of 9% and will reach $8.5 trillion by 2026. (Worldpay)
- 49% of online sales were paid for with digital wallets in 2022. (Worldpay)
- 30% of global online shoppers shop once a month. (DHL)
- Online retailers lose more than $18 billion to abandoned carts every year. (Ecommerce Bonsai)
- Temu was the most-downloaded shopping app in 2023 with over 314 total downloads across the App Store and Google Play. (Statista)
General online shopping statistics
1. The global ecommerce transaction value is expected to reach $8.5 trillion by 2026
According to predictions made by Worldpay, the global ecommerce transaction value will reach $8.5 trillion by 2026 after reaching $6 trillion in 2022.
It will grow at a compound annual growth rate (CAGR) of 9%.
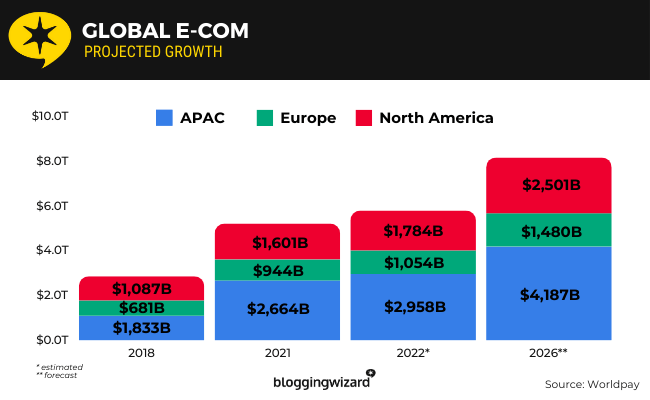
The company has even predicted how much the ecommerce transaction value will grow by region:
- Asia-Pacific (APAC) – The ecommerce transaction value for this region was $2,958 billion in 2022; it will reach $4,187 billion by 2026
- North America (NA) – $1,784 billion; $2,501 billion
- Europe – $1,054 billion; $1,480 billion
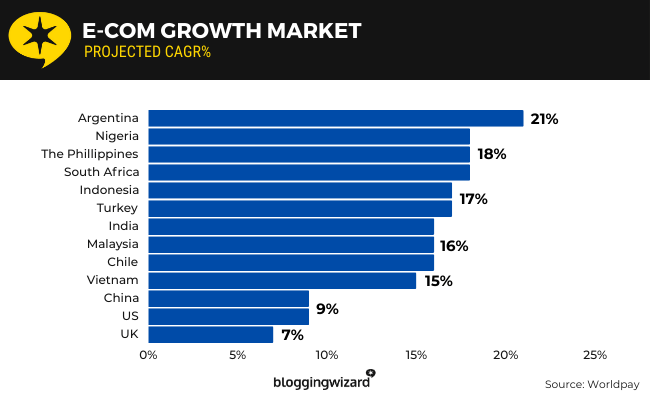
Worldpay have even broken down data from each region to uncover projected CAGRs for individual countries from 2022 to 2026:
- Argentina – 21%
- Nigeria – 18%
- The Philippines – 18%
- South Africa – 18%
- Indonesia – 17%
- Turkey – 17%
- India – 16%
- Malaysia – 16%
- Chile – 16%
- Vietnam – 15%
- China – 9%
- United States – 9%
- United Kingdom – 7%
Source: Worldpay
2. In Quarter 3 of 2023, 61.8% of online sales came from businesses that have no brick-and-mortar stores
According to Pew Research Center’s data, 61.8% of online sales came from online stores with no physical locations.
This accounted for $168 billion for Q3 of 2023.
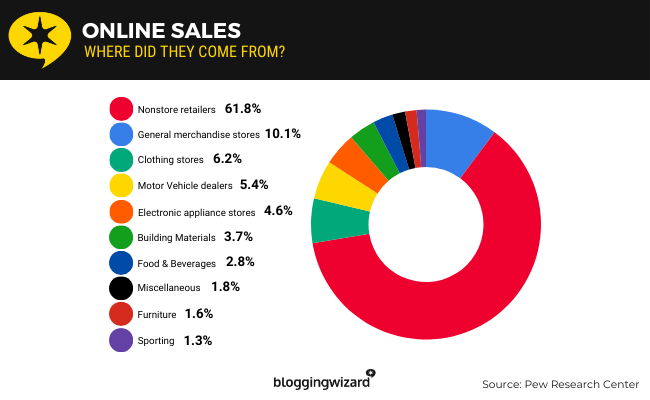
Here’s where the remaining share of online sales went:
- General merchandise stores – Sales from this category made up 10.1% of all sales or $27 billion
- Clothing and clothing accessory stores – 6.2% or $17 billion
- Motor vehicle and parts dealers – 5.4% or $15 billion
- Electronics and appliance stores – 4.6% or $13 billion
- Building materials, garden equipment and supplies dealers – 3.7% or $10 billion
- Food and beverage stores – 2.8% or $7 billion
- Misc. – 1.8% or $5 billion
- Furniture and home furnishings stores – 1.6% or $4 billion
- Sporting goods, hobby, musical instrument and book stores – 1.3% or $4 billion
- Health and personal care stores – 0.7% or $2 billion
Source: Pew Research Center
3. In Quarter 4 of 2022, online sales amounted to $303.1 billion
Pew Research observed the ecommerce industry over Quarter 4 of 2022 and discovered that the ecommerce industry generated $303.1 billion in sales throughout October to December of that year due to holiday and Black Friday shopping.
The quarterly average for the rest of the year was $245.6 billion, making Quarter 4’s sales 23.4% higher than the rest of the year’s.
In spite of this, online sales only accounted for 16.3% of all retail sales during Quarter 4 of 2022.
Source: Pew Research Center
4. 49% of global ecommerce payments were made with digital wallets in 2022
Worldpay collected data on consumer payment methods and preferences in 2022.
They discovered that the majority of payments, or 49%, were made with digital wallets in 2022. They also predict this payment method to make up 54% of the market share by 2026.
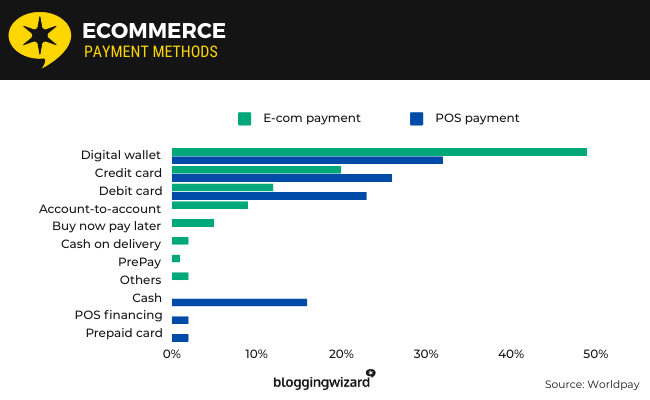
Here’s how other payment methods performed:
- Digital wallet – 49% of online sales were completed using this payment; this number will rise to 54% by 2026
- Credit card – 20%; 16%
- Debit card – 12%; 10%
- Account-to-account (A2A) – 9%; 10%
- Buy now, pay later (BNPL) – 5%; 6%
- Cash on delivery (COD) – 2%; 1%
- PrePay – 1%; 1%
- Others (prepaid cards, PostPay, cryptocurrencies, etc.) – 2%; 2%
Worldpay also discovered how popular A2A is becoming as a payment method, accounting for $525 billion of global ecommerce sales in 2022.
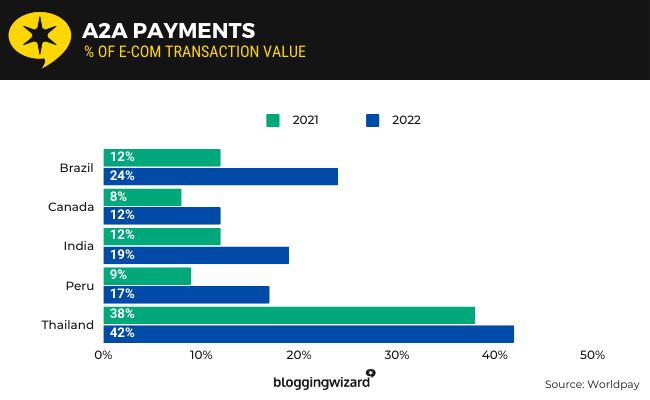
It’s growing fastest in the following countries:
- Brazil – A2A payment methods were used for 12% of transactions in 2021; 24% in 2022
- Peru – 9%; 17%
- India – 12%; 19%
- Canada – 8%; 12%
- Thailand – 38%; 42%
Source: Worldpay
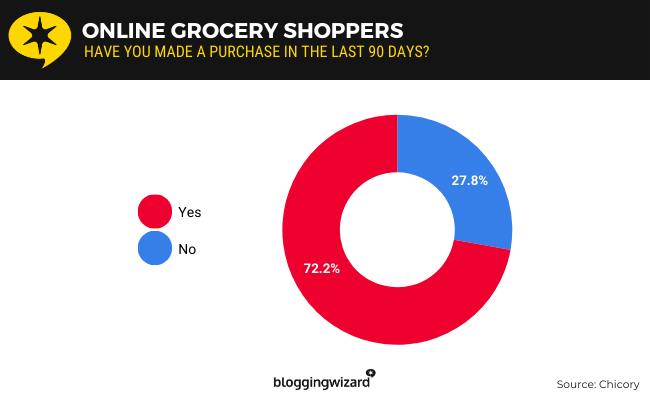
5. 72.2% of consumers in the United States shopped for groceries online at least once over a 90-day period
Chicory asked 1,000 online shoppers in the United States whether or not they’ve made an online grocery purchase in the last 90 days.
72.2% answered “yes.”
Of those who do grocery shopping online, 55.6% live in the suburbs while 25.1% live in the city. 18.8% are from rural parts of America while 0.5% answered “other.”
The majority of these shoppers, or 56%, order groceries online more often than they did a year ago.
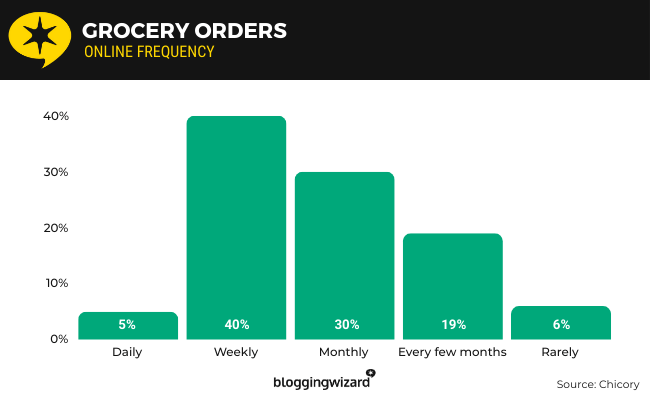
Here’s exactly how often American consumers order groceries online:
- Weekly – 40% of Americans order groceries online this frequently
- Monthly – 30%
- Every few months – 19%
- Rarely – 6%
- Daily – 5%
Source: Chicory
6. The share of retail sales that occur online grew by 11.7% between 1999 and 2019
According to data published by Pew Research Center, online sales only accounted for 0.7% of all retail sales in 1999.
That number grew to 12.4% by 2019.
This means the share of retail sales that occur online grew by 11.7% over a 20-year period.
Source: Pew Research Center
Statistics on online shopping behavior and preferences
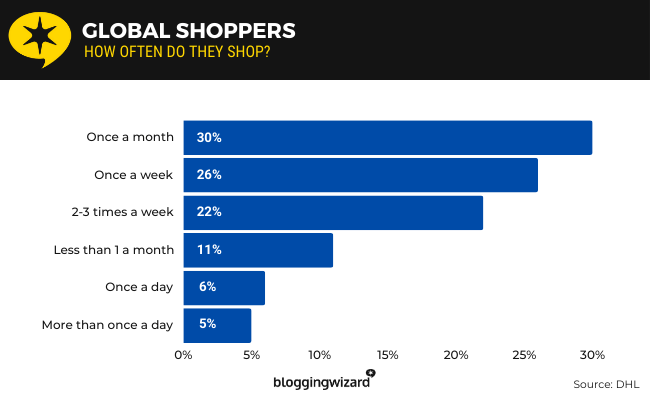
7. 30% of online shoppers from around the world shop once a month
DHL surveyed over 11,000 online shoppers from around the world and asked them how often they shop.
The majority of global consumers shopping online, or 30%, shop once a month:
- Once a month – 30% of global online shoppers shop this often
- Once a week – 26%
- 2-3 times a week – 22%
- Less than once a month – 11%
- Once a day – 6%
- More than once a day – 5%
Here’s how often shoppers in the United States shop:
- Once a week – 26% of online shoppers in the United States shop this often
- Once a month – 25%
- 2-3 times a week – 23%
- Less than once a month – 10%
- Once a day – 10%
- More than once a day – 6%
Here’s often shoppers in the United Kingdom shop:
- Once a month – 33% of online shoppers in the United Kingdom shop this often
- Once a week – 27%
- 2-3 times a week – 16%
- Less than once a month – 15%
- Once a day – 6%
- More than once a day – 5%
Source: DHL
8. Online shoppers spent an average of $2.74 per visit in Quarter 3 of 2023
According to a study published by Statista, which included analyzing data from 29 billion visits from 1.5 billion shoppers to over 2,200 online stores in 61 countries, online shoppers spent an average of $2.74 per visit in the third quarter of 2023.
Home furniture was the most expensive category at $3.42 per visit.
This was followed by the health and beauty category at $2.85 per visit.
Source: Statista1
9. 65% of global online shoppers say their online shopping experiences would be improved by the availability of free delivery
In DHL’s survey, the company asked over 11,000 online shoppers about the online shopping attributes that would improve their online shopping experiences.
65% said their online shopping experiences would be improved if more stores offered free delivery.
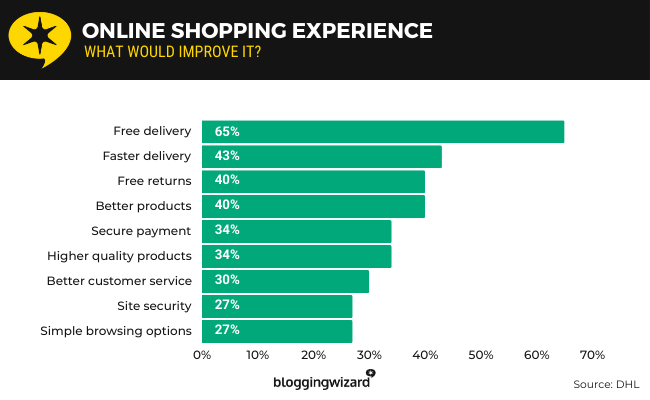
Here’s how online shoppers from around the world responded:
- Free delivery – 65% of global online shoppers say this would improve their online shopping experience
- Faster delivery – 43%
- Free returns – 40%
- Better product descriptions – 40%
- More secure payment process – 34%
- Higher-quality product images – 34%
- Better customer service – 30%
- Better site security – 27%
- Simpler browsing options – 27%
Source: DHL
10. 89% of online shoppers in North America shop at Amazon
According to a survey of over 11,000 online shoppers, 89% of online shoppers in North America shop at online retail giant Amazon.
This is in line with 58% of North American shoppers saying next-day delivery is important to them.
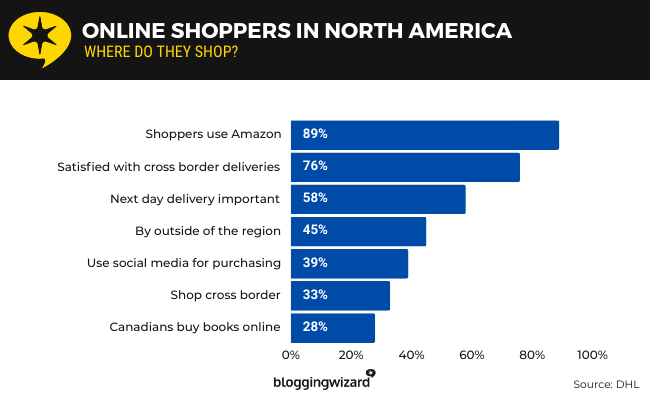
Here are other online shopping behaviors DHL discovered about North Americans:
- Shop at Amazon – 89% of North Americans do this
- Satisfied with cross-border delivers – 76%
- Next-day delivery is important – 58%
- Buy outside of the region – 45%
- Use social media for purchasing support – 39%
- US-based shoppers who will shop cross-border more in the next 12 months – 33%
- Canadians who buy books online – 28% which is more than the 19% of consumers who buy books online
Source: DHL
11. 39% of online shoppers in the United States shop cross borders
According to DHL’s survey, 39% of online shoppers in the United States shop online from stores that deliver from other countries. This is compared to 55% of global online shoppers who shop cross border.
Our previous statistic also uncovered that 33% of US-based online shoppers plan on doing cross-border online shopping over the next 12 months, and 76% of North American shoppers have been satisfied with their experiences with cross-border shopping.
The top three countries online shoppers in the United States buy from are China at 35%, the United Kingdom at 27% and Canada at 17%.
As for why US-based shoppers buy from online retailers in other countries, DHL uncovered these reasons:
- Lower prices – 43% of shoppers in the United States buy from other countries for this reason
- Previous good experience – 39%
- Wider choice of products – 33%
- The product or brand isn’t available in the United States – 29%
- Better-quality products – 28%
- Delivery is faster – 24%
- Low delivery costs – 22%
Source: DHL
12. 48% of online shoppers say fraud and longer wait times are their biggest reasons for not shopping abroad
According to DHL’s survey, 48% of online shoppers cite fraud as the biggest reason for not doing cross-border shopping.
Another 48% cited longer wait times as an issue.
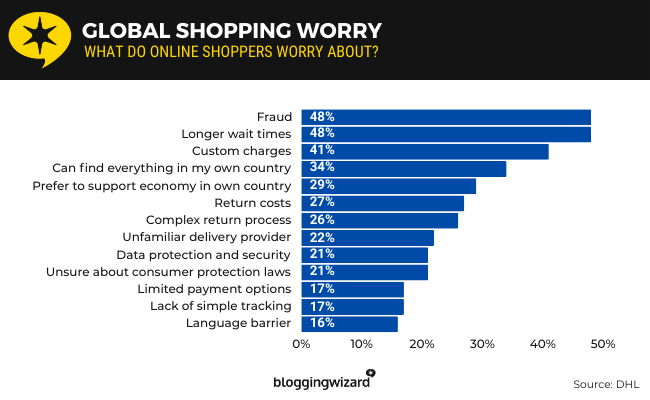
Here are other issues global online shoppers worry about when buying from other countries:
- Fraud – This stops 48% of global online shoppers from buying from other countries
- Longer wait times – 48%
- Customs charges – 41%
- I can find everything I need in my own country – 34%
- I prefer to support the economy in my own country – 29%
- Return costs – 27%
- Complex return process – 26%
- Unfamiliar delivery provider – 22%
- Data protection and security – 21%
- Unsure about different consumer protection laws – 21%
- Limited payment options – 17%
- Lack of simple tracking – 17%
- Language barrier – 16%
These attributes would encourage more consumers to shop from other countries more:
- Prices in my own currency – 50% of global online shoppers say this would encourage them to buy from other countries more
- Simple, free returns – 49%
- Clear guide on customs and duties charges – 47%
- Well-packaged goods – 34%
- Transparent consumer rights – 33%
- Website in native language – 31%
- Carbon off-setting – 12%
Source: DHL
13. 72% of online shoppers worldwide prefer to make holiday and entertainment purchases online
Statista published data from a survey that included responses from 36,000 respondents from around the world.
They discovered that 72% of online shoppers prefer to shop online when making holiday and entertainment purchases.
Source: Statista2
14. 43% of consumers in the United States would prefer to shop online than in store
Data from a survey published by Statista, a survey that had over 17,000 respondents, revealed that 43% of consumers in the United States would prefer to shop online than in store if given the opportunity.
Shopping in physical stores was most popular among Austria, Finland and New Zealand.
Source: Statista3
15. 41% of online shoppers say reliable delivery is the most important attribute to consider when deciding where to shop online
According to a report published by PWC, the majority of shoppers, or 41%, agree that reliable delivery is the most important attribute to consider when buying online.
Other important attributes are as follows:
- Reliable delivery – 41% of online shoppers believe this to be the most important attribute
- Availability of products – 35%
- Good return policy – 31%
- Easy site navigation – 30%
- Availability of customer reviews – 26%
- Ability to see an extended range of stock compared to physical stores – 26%
- Easy-to-use mobile app interface – 23%
Source: Ecommerce Bonsai1
16. Only 18% of consumers who buy cryptocurrency use it as a payment method for ecommerce sales
Worldpay’s survey of consumers who shop online revealed that although 77% of consumers buy cryptocurrency as an investment, only 18% use it as a payment method at checkout.
Cryptocurrency accounted for 0.19% of global ecommerce sales in 2022, or $11.6 billion.
Source: Worldpay
Online shopping statistics for retail stores
17. Collectively, online retail stores lose up to $18 billion in sales annually due to cart abandonment
According to data conducted by Forrester Research and published by Dynamic Yield, online stores lose as much as $18 billion in yearly sales due to abandoned carts.
In the world of ecommerce, online shoppers make a habit of putting items into their carts and then leaving without completing online purchases.
Whether they’re saving the items for later or were simply determining how much their orders would be, retail stores lose as much as $18 billion in annual sales to the practice.
Experts even warn this number could reach as much as $4 trillion in the coming years.
Source: Ecommerce Bonsai2
18. 31% of small businesses say their top selling challenge is the competition they face from low-cost providers
According to data from Richardson, 31% of small businesses name competition from low-cost providers as their biggest selling challenge.
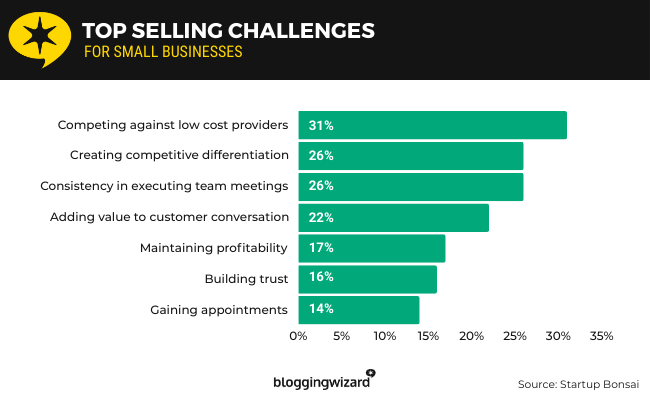
The study listed other challenges as well:
- Competition from low-cost providers – 31% of small businesses list this as a selling challenge
- Creating competitive differentiation – 26%
- Consistency in executing team meetings with prospects – 26%
- Adding value to customer conversations – 22%
- Maintaining profitability – 17%
- Building trust – 16%
- Gaining appointments – 14%
Source: Ecommerce Bonsai3 (previously Startup Bonsai)
19. Amazon has a 37.8% market share in the ecommerce sector of retail
According to data published by Statista, Amazon has the largest market share in ecommerce at 37.8%.
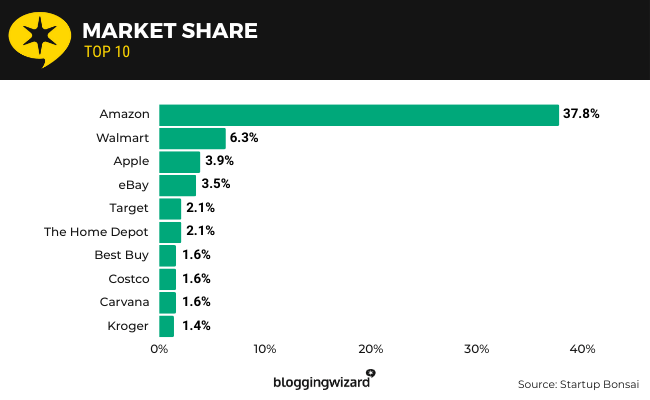
Next is Walmart at 6.3% followed by Apple at 3.9%. eBay comes in third at 3.5%.
Here are other top ecommerce retailers in terms of market share:
- Amazon – This online retailer has a 37.8% market share in ecommerce
- Walmart – 6.3%
- Apple – 3.9%
- eBay – 3.5%
- Target – 2.1%
- Home Depot – 2.1%
- Best Buy – 1.6%
- Costco – 1.6%
- Carvana – 1.6%
- Kroger – 1.4%
- Wayfair – 1.1%
- Chewy – 1%
- Macy’s – 0.9%
- Lowe’s – 0.9%
- Qurate Retail Group – 0.7%
Source: Ecommerce Bonsai4
20. Temu was downloaded over 314 million times by December of 2023
AppMagic and Statista published a study on online shopping apps.
They discovered Temu to be the most popular app with over 314 million downloads across the App Store and Google Play.
SHEIN was the second most popular app with over 250 million downloads.
Source: Statista4
Sources
- Pew Research Center
- Worldpay
- Chicory
- DHL
- Statista1
- Statista2
- Statista3
- Statista4
- Ecommerce Bonsai1
- Ecommerce Bonsai2
- Ecommerce Bonsai3
- Ecommerce Bonsai4
Final thoughts
These online shopping statistics do a lot to prove how influential online shopping has become in spite of online retail sales only making up less than a fifth of all retail sales.
When people shop online, they’re spending more now than ever, and those numbers are only expected to grow.
It seems if retailers want to stay competitive and keep customers happy, they’ll need to consider offering more reliable and cheaper delivery options as well as accept payments from digital wallet apps.
They should also improve the mobile shopping experience of their stores by optimizing their online retail stores for mobile devices.
Be sure to read our review of Shopify if you’re thinking of starting your own online store.