21 Top Live Chat Statistics And Trends For 2024

Considering implementing live chat on your website? Need a few live chat statistics to validate your decision?
Live chat and AI chatbots are revolutionizing the way businesses conduct customer service.
In this post, we list the best live chat statistics reported from around the web. They’re broken down into a few different categories, including general stats, statistics on the customer experience and chatbot statistics.
Editor’s top picks – live chat statistics
These are the top live chat stats from this post:
- Live chat is a primary customer service tool used by 40% of support teams. (Intercom)
- 63.28% of consumers are willing to use live chat to get in touch with customer support. (Hiver)
- Businesses who offer live chat support spend an average of 10 hours and 26 minutes chatting with customers per day. (LiveChat)
- The average duration for live chat conversations is eight minutes and 16 seconds. (LiveChat)
- 44% of support teams will invest in chatbots for customer support in 2024. (Intercom)
General live chat statistics
1. 40% of support teams say live chat software is one of their most-used tools
According to a survey conducted by Intercom, which included responses from 2,000 professionals, 40% of support teams say live chat software is one of their most-used tools.
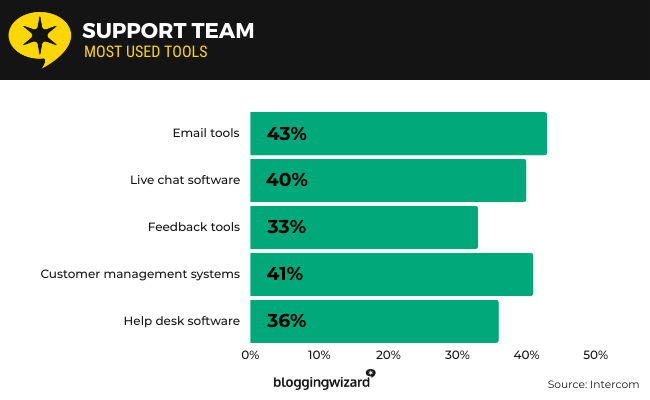
Here are other tools support teams use:
- Email tools – 43% of support teams say this is one of their most-used tools
- Customer relationship management systems – 41%
- Live chat software – 40%
- Help desk software – 36%
- Feedback and survey tools – 33%
Source: Intercom1
2. 63.28% of consumers use live chat to communicate with customer support
Hiver, who own a software-as-a-service (SaaS) application that allows companies to communicate with customers, employees and collaborators alike through business email tools like Google Workspace, conducted a survey that included responses from over 1,200 consumers from around the United States.
Respondents were asked about the support channels they use to contact businesses.
They discovered that while the majority of consumers use email or phone support, 63.28% use live chat.
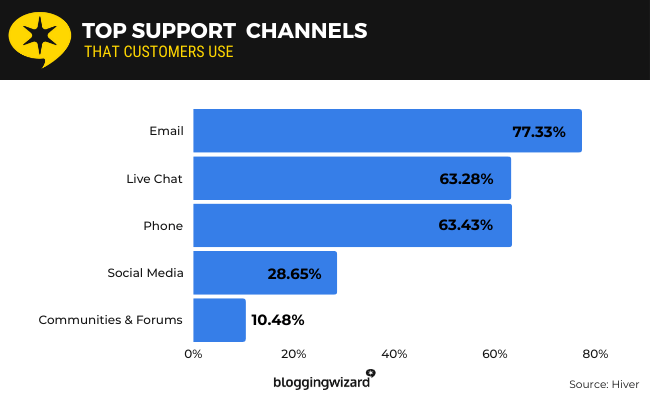
Here are all the results:
- Email – 77.33% of consumers use email to contact businesses
- Phone – 63.43%
- Live Chat – 63.28%
- Social Media – 28.65%
- Forums – 10.48%
You can see how live chat came in a close third to phone support.
Source: Hiver
3. Businesses conducted over 104 million chats through the LiveChat live chat software application in 2022
LiveChat, who operate a live chat customer support software application, publishes an annual customer service report. This report includes data on its own application.
They reported that 2022 saw their customers conducting 104,232,313 chats.

They also discovered that each live chat agent that uses their application conducts an average of 24.1 chats per day.
LiveChat currently has over 37,000 customers.
Source: LiveChat1, LiveChat2
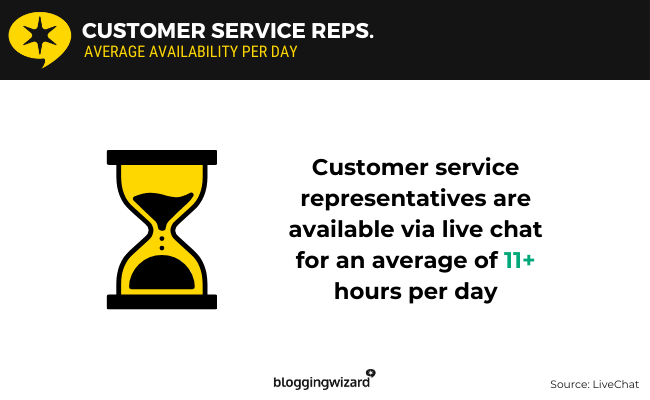
4. Customer service representatives are available via live chat for an average of 11+ hours per day
According to LiveChat’s own statistics on how its customers use its customer service application, businesses are available for customer service via live chat for an average of 11 hours and 55 minutes every day.
Source: LiveChat1
5. Businesses chat with customers through live chat for an average of 10.5 hours every day
According to LiveChat’s live chat statistics on its customer base, businesses who offer live chat service spend an average of 10 hours and 26 minutes per day chatting with customers through live chat.
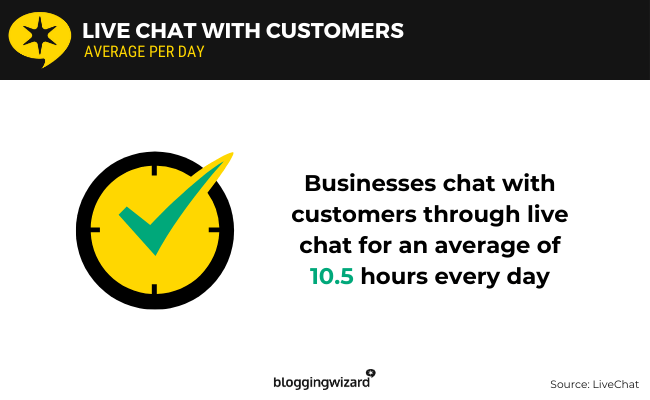
Each individual agent spends an average time of three hours and 18 minutes chatting with customers each day.
Source: LiveChat1
6. The average live chat call duration is just over eight minutes
LiveChat’s customer base spent an average of eight minutes and 16 seconds chatting with customers through live chat in 2022.
This average is on a per-chat basis.
Source: LiveChat1
7. The business and wholesale service industry has the longest live chat call duration in the world at 26 minutes on average
According to data published by Statista, the average call duration for live chat customer service conversations in the global business and wholesale service industry is 26 minutes.
The media, entertainment and recreation industry has the shortest call duration at just seven minutes.
Source: Statista1
8. The average amount of time is takes for businesses to respond to customers through live chat is 41 seconds
LiveChat’s customers took an average amount of time of 41 seconds to respond to customer queries through live chat in 2022.
However, when customers are placed in a queue, the average wait time is four minutes and 23 seconds.
25.4% of customers leave queues on average.
Source: LiveChat1
9. Only 8.6% of live chats conversations receive ratings for customer satisfaction
According to LiveChat’s statistics on its customers’ activity, only 8.6% of the over 104 million chats conducted through the application received customer satisfaction ratings.
So, while the average customer satisfaction rating is 71.4%, only 8.96 million of the 104 million chats conducted through LiveChat in 2022 received satisfaction ratings.
The company’s report goes on to explain how satisfaction is highest among businesses whose average response time is between 10 and 20 seconds. These businesses have an average live chat satisfaction rating of 76.8%.
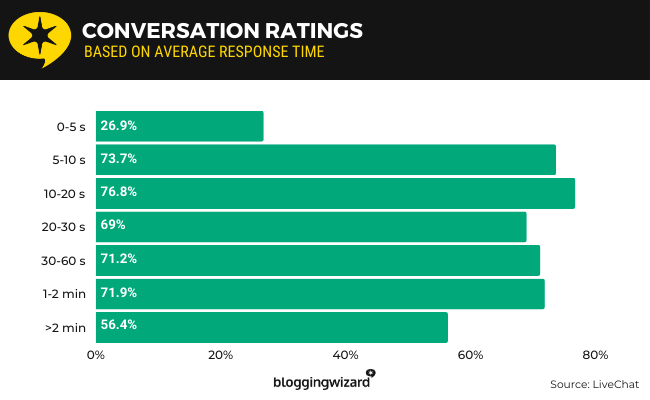
Here are LiveChat’s customer base’s average satisfaction ratings based on average response time:
- 0-5 seconds – Businesses whose average response time falls into this category have an average satisfaction rating of 26.9%
- 5-10 seconds – 73.7%
- 10-20 seconds – 76.8%
- 20-30 seconds – 69%
- 30-60 seconds – 71.2%
- 1-2 minutes – 71.9%
- Over 2 minutes – 56.4%
Source: LiveChat1
10. 73.6% of live chat conversations occur on mobile devices
LiveChat’s customer service application is mobile friendly. Therefore, its customers are able to integrate it with their websites so their customers can get in touch with their live chat customer service option from their mobile devices.
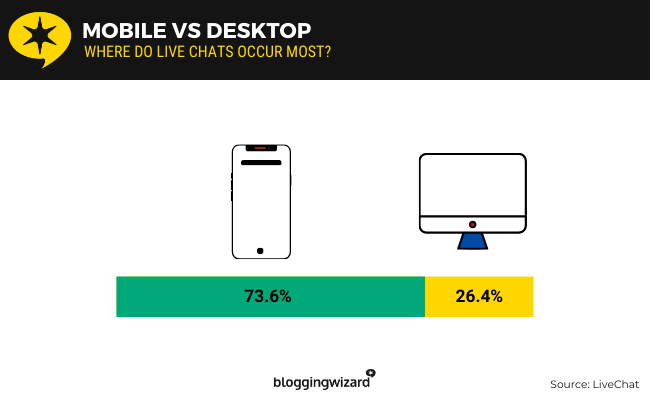
Based on LiveChat’s statistics, 73.6% of live chat conversations happen on mobile devices while the remaining 26.4% happen on desktop.
Source: LiveChat1
11. Tidio has over 300,000 live chat users
Out of all SaaS companies who offer live chat as a primary feature, Tidio has the most number of customers at over 300,000.
Their customers include Glovio, Praktiker, Wasatch Group and Jaguar.
They offer a free plan, and premium plans start at $29/month.
Here’s how other live chat tools fare in comparison:
- Tidio – 300,000+ customers
- Customers: Glovio, Praktiker, Wasatch Group, Jaguar
- Cost: Free plan available. Premium plans start at $29/month
- Zendesk – 100,000+ customers
- Customers: Tesco, LUSH, Instacart, GrubHub, Siemens, Uber, Squarespace, Shopify
- Cost: Plans start at $69/month per agent
- LiveChat – 37,000+ customers
- Customers: McDonald’s, Mercedes Benz, Adobe, Unilever, PayPal
- Cost: Plans start at $24/month for one agent or $49/month per agent for more than one
- Intercom – 25,000+ customers
- Customers: Udemy, Amazon, Meta, Atlassian, Notion, Etoro, H&R Block, Xero, Microsoft, Angi
- Cost: Plans start at $39/month per agent
- Help Scout – 12,000+ customers
- Customers: Honey, Buffer, Spikeball, Mixmax, Spindrift, Compass
- Cost: Plans start at $25/month per agent
Source: Tidio, Zendesk, Intercom2, LiveChat2, Help Scout
Live chat statistics about the customer experience
12. The average customer wait time for live chat dropped to 30 seconds globally in 2022
According to Statista’s data, the average customer wait time for live chat dropped from 50 seconds in 2019 to 35 seconds in 2020 before finally dropping to 30 seconds in 2022.
This puts the global average for live chat customer wait times at 30 seconds.
Source: Statista2
13. 38.12% of consumers find the chatbot’s inability to understand context the most annoying aspect of live chat customer support
While customers expect live chat to be efficient, according to Hiver’s survey, the majority of consumers, or 38.12%, find it annoying when chatbots aren’t able to understand context.
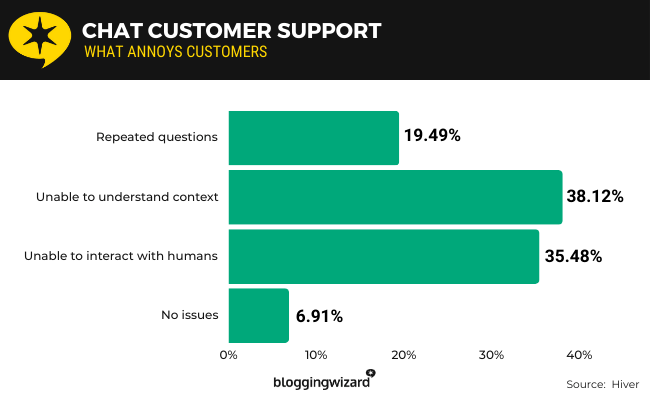
Here are other aspects of live chat that annoy customers:
- Chatbot unable to understand context – 38.12% of consumers find this aspect of live chat annoying
- Unable to interact with an actual human – 35.48%
- Having to repeat the question multiple times – 19.49%
6.91% say they have no issues with live chat support.
Source: Hiver
General chatbot statistics
14. 44% of businesses will invest in chatbots for customer support in 2024
According to a survey of 2,000 professionals by live chat software application Intercom, 44% of businesses will invest in chatbots for customer support in 2024.
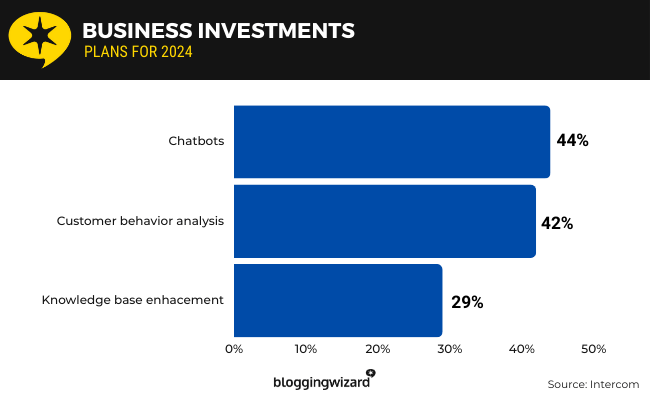
42% will also invest in customer behavior analysis while 29% will enhance their knowledge bases.
Source: Intercom1
15. 30% of C-level executives say implementing automated support with chatbots will be a top priority in 2024
Intercom asked 2,000 professionals, which included C-level executives, about their company’s main priorities for customer service in 2024.
30% say implementing automated support through the use of chatbots will be a main priority for their companies in 2024.
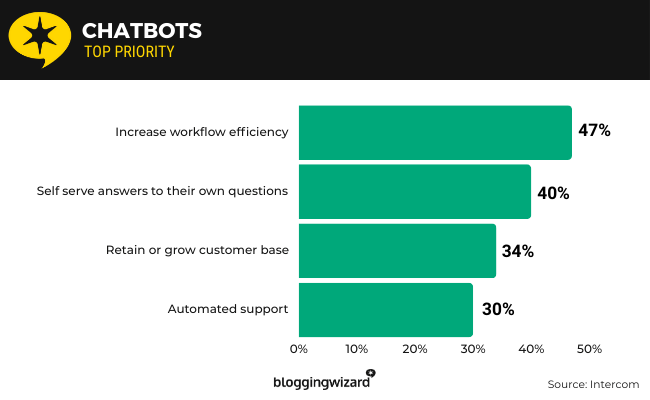
Here are other main priorities companies have for 2024:
- Increasing workflow efficiency – 47% of C-level executives say this will be a main priority in 2024
- Empowering customers to self-serve answers to their own questions – 40%
- Helping the organization retain or grow the customer base – 34%
- Automated support with chabots – 30%
Source: Intercom1
16. 42% of support leaders believe “chatbot analyst” will be a new role introduced to customer support teams within the next five years
Intercom asked 2,000 professionals about new job roles they believe will be added to customer service teams within the next five years.
The majority, or 42%, believe chatbot analysts will play a bigger role within the next five years.
Most new roles support leaders believe will be added have to do with strengthening companies’ adoption of artificial intelligence into key customer support strategies:
- Chatbot analyst – 42% of support leaders believe this job role will be added to customer support teams within the next five years
- Conversational UX mapper – 32%
- AI customer support specialist – 29%
- Conversation designer – 26%
Source: Intercom1
General customer support statistics
17. 44% of support teams use customer satisfaction scores to gauge the customer experience
Intercom asked 2,000 professionals about the ways in which their support teams determine the effectiveness of their organization’s customer experience.
The majority, or 44%, use CSAT scores, which are customer satisfaction scores.
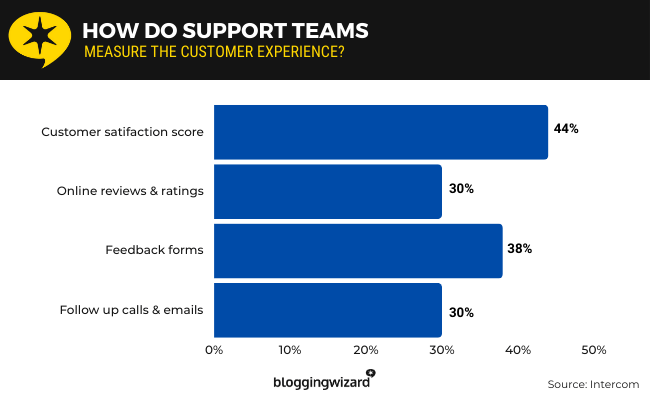
38% use feedback forms.
30% use online reviews and ratings, and another 30% use follow-up calls and emails.
Source: Intercom1
18. 71.82% of consumers switch to different brands after having negative customer experiences
Hiver asked consumers how they respond when they have negative customer experiences.
71.82% of consumers plan to switch to different brands after this happens.
52.48% tell family and friends not to purchase anything from brands they have negative experiences with.
35.87% share negative experiences on social media and review sites.
Source: Hiver
19. 72.52% of consumers say they frequently wait longer than usual for solutions to their problems
Hiver’s survey revealed that the vast majority, or 72.52%, of consumers frequently wait longer than usual for customer support to find solutions for their issues.
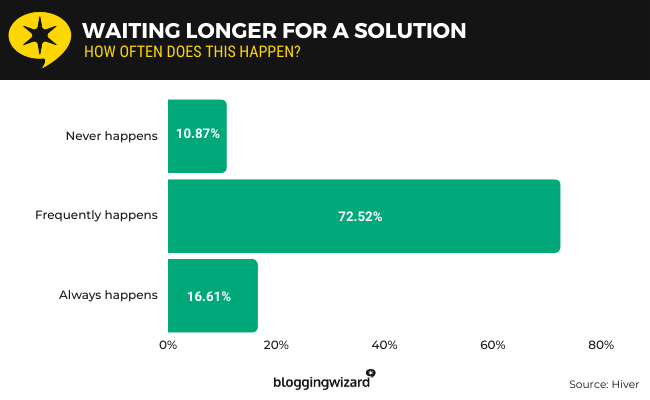
16.61% say waiting longer than usual always happens while only 10.87% say it never happens.
Source: Hiver
20. 65.53% of consumers say they frequently have to repeat themselves to customer support
Hiver asked consumers how often they have to repeat their issues to customer support.
65.53% say instances where they have to repeat their issues to customer support occur frequently.
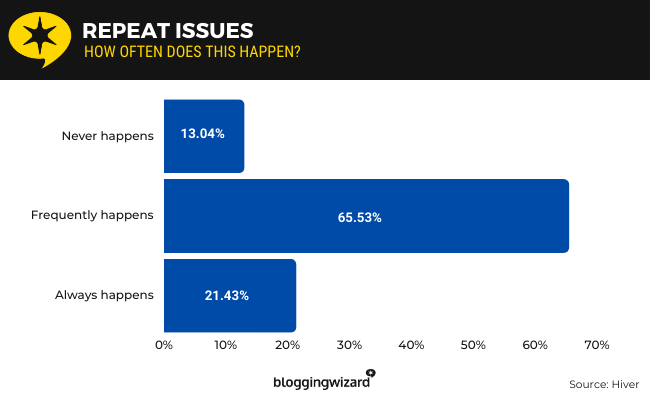
21.43% say it always happens while only 13.04% say it never happens.
Source: Hiver
21. 52.17% of consumers expect their issues to be resolved within one day
According to Hiver, the majority of consumers, or 52.17%, expect their issues to be resolved through customer support within one day.
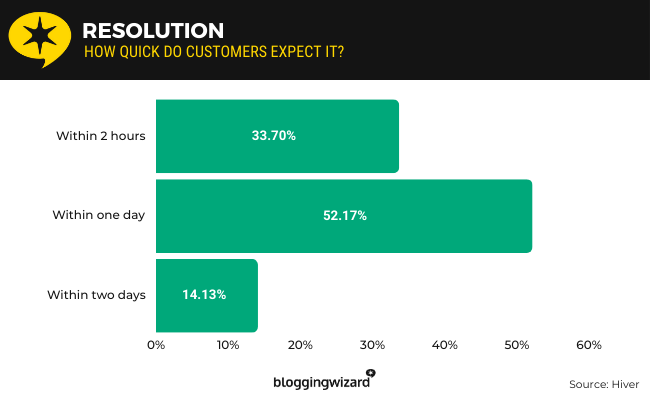
33.7% expect them to be resolved within two hours while 14.13% are fine with waiting two days.
Source: Hiver
Sources
Final thoughts
The live chat statistics in this post prove how live chat is an important component of good customer service.
It can help you meet customer expectations, and if you implement it efficiently, it can even lead to customer loyalty.
It all starts with the right tool, so be sure to check out our guide on the best live chat applications.
Related reading: