27 Top Landing Page Statistics For 2024: The Definitive List

Curious about the latest landing page statistics?
What elements does a good landing page have? What sort of content does a high-converting landing page have?
This post includes answers to these questions from statistics sourced from surveys and studies published around the web.
We organized the statistics into a few different categories, including general stats and stats for landing page design and strategies.
Editor’s top picks – landing page statistics
These are the best landing page stats from this post:
- The average conversion rate for landing pages is 2.35% regardless of industry. (Startup Bonsai)
- Websites that publish more than 40 landing pages have 12x the number of conversions as websites who only publish five or less. (Startup Bonsai)
- Landing pages that use a single call to action have an average conversion rate of 13.5%. (Unbounce)
- Stripping a landing page of its navigation doubles its conversion rate. (VWO)
- Videos have the biggest impact on the conversion rate of landing pages, according to 38.6% of marketers. (HubSpot)
- 51.5% of marketers use social media to attract traffic to their landing pages. (HubSpot)
General landing page statistics
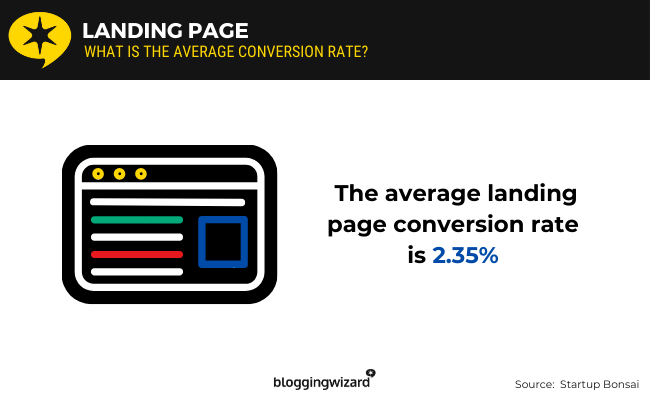
1. The average landing page conversion rate is 2.35%
This landing page statistic comes from Wordstream and was published by Startup Bonsai. According to the statistic, the average landing page conversion rate is 2.35%.
Source: Startup Bonsai1
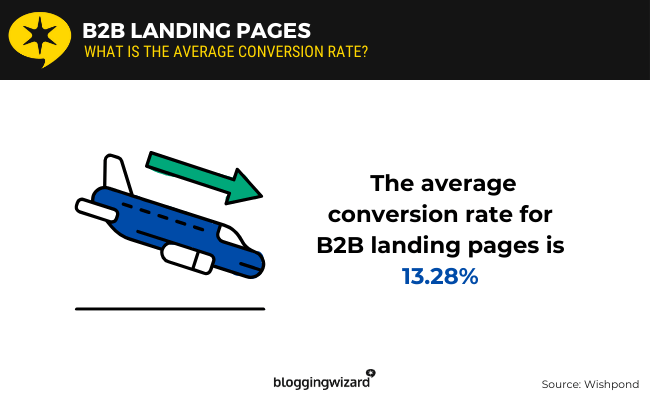
2. The average conversion rate for B2B landing pages is 13.28%
Wishpond is a marketing platform that includes a landing page builder with hosting capabilities.
The company conducted an analysis of its customer base and determined that landing pages made by business-to-business companies (B2B) have an average conversion rate of 13.28%.
Source: Wishpond
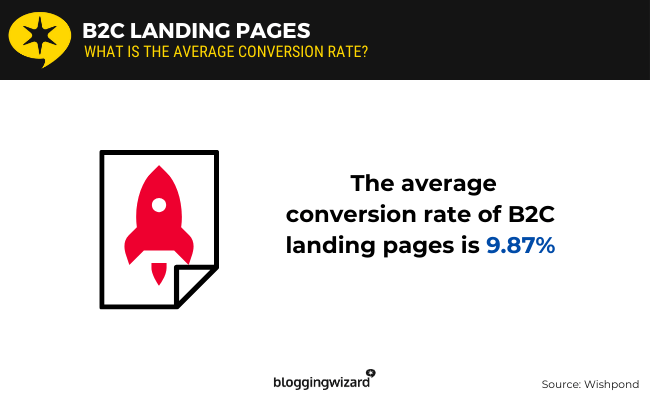
3. The average conversion rate of B2C landing pages is 9.87%
According to Wishpond’s analysis of its customer base, the average conversion rate of a business-to-consumer (B2C) landing page is 9.87%.
Source: Wishpond
4. The average median form submission rate for landing pages is 4.14% across all industries
Unbounce is a landing page host and application. They conduct a regular analysis of their customer base’s landing page performance, then organize that data by industry.
According to Unbounce’s report, the average median for landing page form submission rates is 4.14% across all industries.
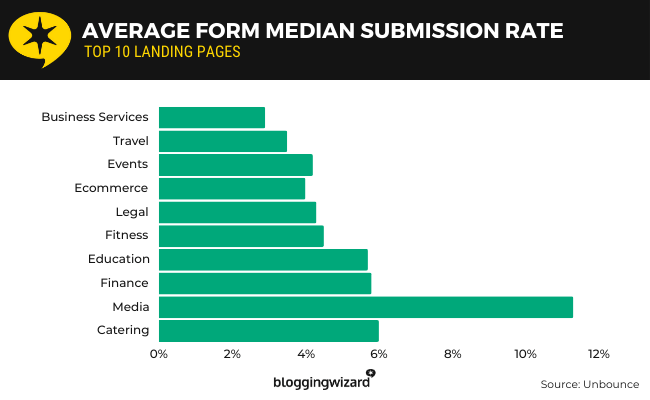
Here’s the full list of median form submission rates from Unbounce:
- Media and entertainment – This industry has a median form submission rate of 11.3%
- Catering and restaurants – 6%
- Finance and insurance – 5.8%
- Education – 5.7%
- Fitness and nutrition – 4.5%
- Legal – 4.3%
- Events and leisure – 4.2%
- Ecommerce – 4%
- Travel – 3.5%
- Business services – 2.9%
- Medical services – 2.9%
- Home improvement – 2.5%
- Software as a service (SaaS) – 2.4%
- Family support – 2.2%
- Real estate – 2.1%
- Agencies – 1.9%
Source: Unbounce1
5. The average median click-through rate for landing pages is 11.3% across all industries
According to Unbounce’s conversion benchmark report, the average median for landing page click-through rates is 11.3% across all industries.
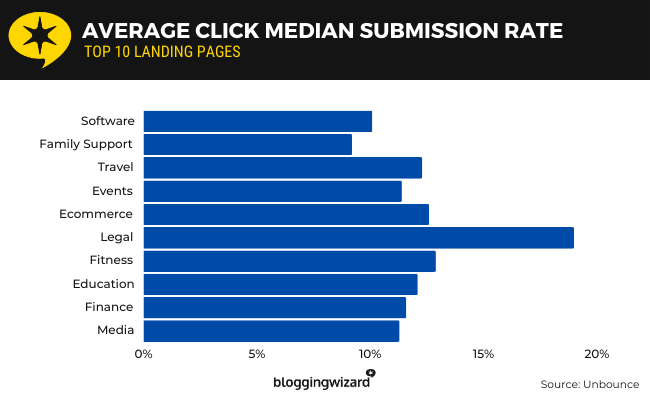
Here’s the full list of median click-through rates for all industries from Unbounce’s report:
- Catering and restaurants – The median click-through rate for this industry is 21.2%
- Legal – 19%
- Fitness and nutrition – 12.9%
- Ecommerce – 12.6%
- Travel – 12.3%
- Education – 12.1%
- Finance and insurance – 11.6%
- Events and leisure – 11.4%
- Media and entertainment – 11%
- SaaS – 10.1%
- Family support – 9.2%
- Home improvement – 9.1%
- Business services – 8.6%
- Agencies – 7.9%
- Medical services – 5.9%
- Real estate – 5.9%
Source: Unbounce1
6. Lead generation is a top priority when creating landing pages for 43.6% of marketers
HubSpot surveyed over 100 “seasoned” marketing and advertising experts about their marketing strategies when it comes to landing pages.
When asked what they’re most commonly trying to generate with landing pages, 43.6% of marketers, which was the majority, chose “leads (contact information).”
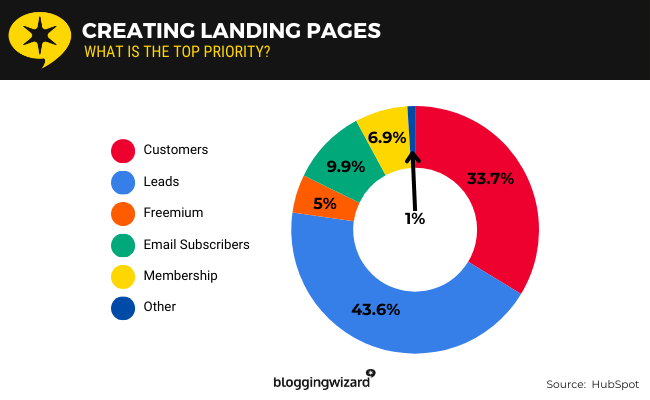
33.7% chose “customers (or direct purchases).”
Here are the rest of the results:
- Leads (contact information) – 43.6% of marketers are trying to generate this with landing pages
- Customers (or direct purchases) – 33.7%
- Email subscribers – 9.9%
- Membership or paid subscriptions – 6.9%
- Freemium product signups – 5%
- Other – 1%
Source: HubSpot1
7. Landing pages that load in one second or less have a conversion rate of 31.79%
According to data collected by Portent and published by Startup Bonsai, landing pages that load in less than one second have a conversion rate of 31.79%.
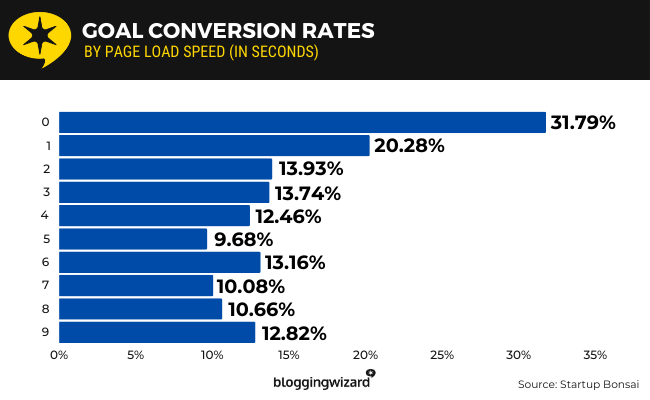
Here are the full list of landing page conversion rates, according to Portent:
- 0 seconds – Sites that load in this amount of time have a conversion rate of 31.79%
- 1 second – 20.28%
- 2 seconds – 13.93%
- 3 seconds – 13.74%
- 4 seconds – 12.46%
- 5 seconds – 9.68%
- 6 seconds – 13.16%
- 7 seconds – 10.08%
- 8 seconds – 10.66%
- 9 seconds – 12.82%
Source: Startup Bonsai2
8. Web forms that have five or fewer fields have higher conversion rates
According to HubSpot’s survey and analysis of email lead capture, the majority of marketers use five fields in forms.
In fact, 31 out of 173 marketers, or 17.92%, use this many fields in their forms.
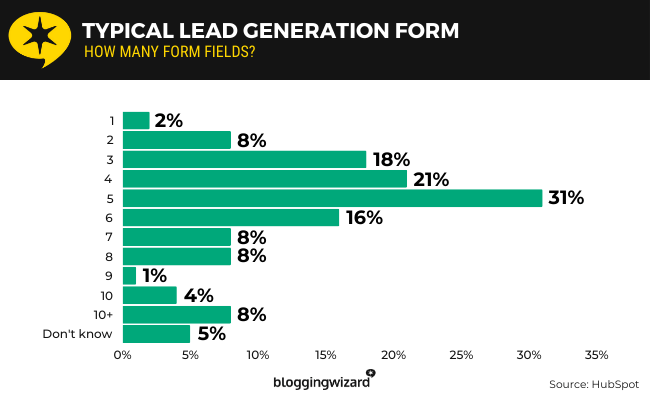
And according to HubSpot’s analysis, forms that have fewer fields tend to convert better.
Here are the full results from HubSpot’s survey:
- Five – 31% of marketers use this many fields in their forms
- Four – 21%
- Three – 18%
- Six – 16%
- Two – 8%
- Seven – 8%
- Eight – 8%
- More than 10 – 8%
- 10 – 4%
- One – 2%
- Nine – 1%
5% of marketers aren’t sure how many fields they typically use in their forms.
Source: HubSpot2
9. 26.5% of marketers say phone number is the most important field to include in forms after name and email
According to HubSpot’s survey, 26.5% of marketers, which was the majority, say phone number is the most important field to include in lead generation forms after including fields for name and email address.
18.3% voted for “years of experience.”
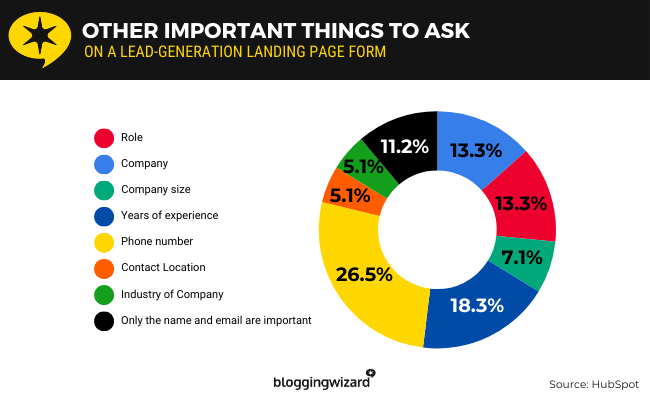
Here are the rest of the results:
- Phone number – 26.5% of marketers say this is the most important field to include in forms after name and email
- Years of experience – 18.3%
- Role – 13.3%
- Company – 13.3%
- Only the name and email are important – 11.2%
- Company name – 7.1%
- Contact location – 5.1%
- Industry of company – 5.1%
Source: HubSpot1
10. Marketers who use multi-step forms are 17% more satisfied with their lead generation efforts
According to HubSpot’s survey, only 39% of marketers use multi-step forms.
Of those who do, 17% are more satisfied with their lead generation efforts.
These marketers’ self-reported landing page conversions are also 86% higher.
Source: HubSpot2
11. Around 50% of marketers use lead magnets to capture emails on landing pages
According to HubSpot’s survey, around 50% of marketers use lead magnets to capture emails on landing pages.
Around 40% do not use lead magnets, and just under 10% voted for “don’t know.”
Just under 50% of marketers use ebooks as lead magnets. Others use webinars, checklists and free tools.
Source: HubSpot2
12. Websites that have more than 40 landing pages generate 12x as many leads as websites with fewer than six
According to data published by Startup Bonsai and originally collected by HubSpot, websites that have at least 41 landing pages generate 12x as many leads as websites that have between one and five landing pages do.
According to the data, B2B and B2C websites with at least 41 landing pages are able to generate over 500 leads whereas websites with between one and five landing pages are only able to generate fewer than 100 leads.
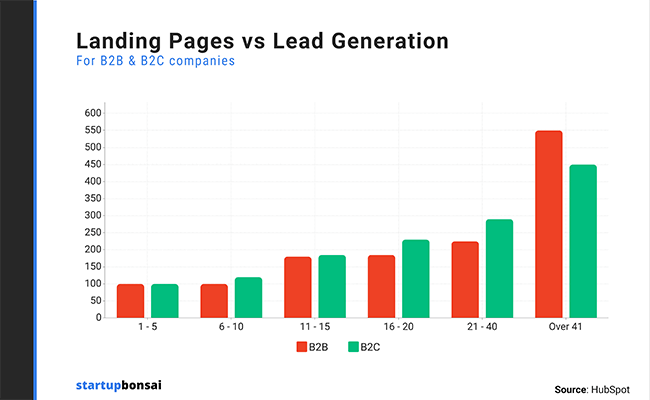
If you have between six and 20 landing pages, you can expect to generate between 100 and 200 leads on average.
Websites with 21 to 40 landing pages can expect to generate fewer than 300 leads.
Source: Startup Bonsai3
Statistics on landing page design
13. Landing pages with one call to action have an average conversion rate of 13.5%
After analyzing 18,639 landing pages, Unbounce determined that landing pages that have a single CTA link have an average conversion rate of 13.5%.
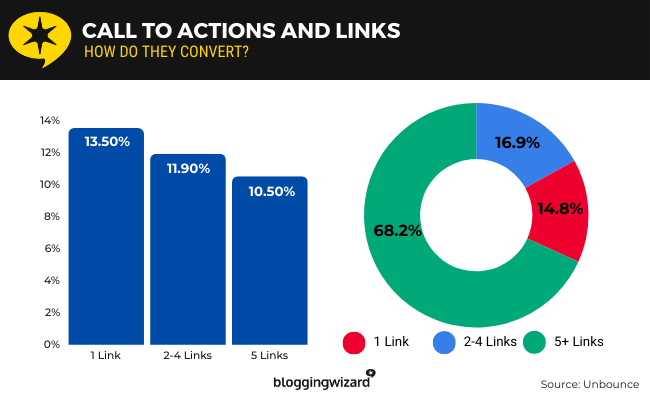
Landing pages that have two to four CTA links have an average conversion rate of 11.9% whereas pages with more than five links have an average conversion rate of 10.5%.
Unbounce also pointed out that most landing pages, or 68.2% of the landing pages they tested, had over five CTA links.
Only 14.8% of landing pages used a single CTA link. 16.9% used between two and four.
Source: Unbounce2
14. Removing navigation from landing pages doubles their conversion rates
According to a case study conducted by landing page optimization platform VWO, removing navigation from landing page designs doubles their conversion rates.
VWO customer Yuppiechief used the platform to run A/B tests on landing page redesigns.
They discovered that simply removing the navigation menu from their landing page increased conversions from 3% to 6%. That’s a 100% increase in conversions.
Source: VWO
15. A/B testing hero images and call to action buttons helped Obama generate $60 million more in campaign funds
Dan Siroker wrote a piece for Optimizely in which he detailed how he helped the 2008 Obama Campaign generate $60 million more in funding through A/B testing he conducted on Barack Obama’s campaign landing page.
He tested two components: the page’s hero image and the text on the call to action (CTA) button assigned to the page’s primary email form.
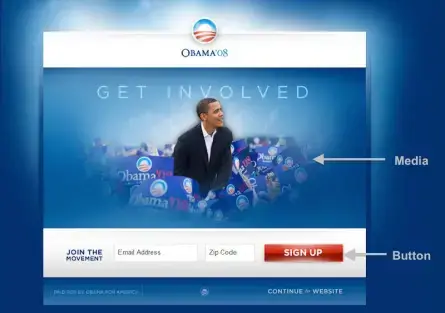
The campaign only used two fields: one for an email address and one for the user’s ZIP code.
He tested four different CTA buttons: Join Us Now, Learn More, Sign Up Now and Sign Up.
He used Google Optimize to conduct the test, though it was called Google Website Optimizer at the time. This allowed him to run all variations he created live at once, which meant that each variation received an equal number of visits during the testing period, 13,000 each to be exact.
He found that the best variation was “Combination 11,” which featured an image of Obama with his family and the “Learn More” CTA button.
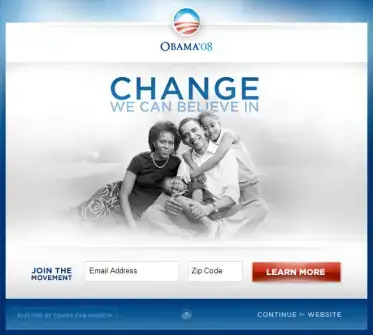
As for the final results, and how Dan came to the conclusion that this experiment awarded the Obama campaign an additional $60 million in funding, the original page had a conversion rate of 8.26%.
The new variation had a conversion rate of 11.6%, which meant the new page raised the landing page’s conversion rate by 40.44%.
Around 10 million people signed up on this page. If they hadn’t conducted the experiment, these numbers mean that only 7.12 million people would have signed up had they kept the original design.
And because each email subscriber translated into an average donation of $21, this meant that additional 2.88 million subscribers awarded the Obama campaign an additional $60.48 million in funding.
Source: Optimizely
16. 38.6% of marketers say videos have the greatest impact on conversions for landing pages
According to a survey conducted by HubSpot, 38.6% of experienced marketers say videos have the biggest impact on conversions when inserted into landing pages.
35.6% say images and graphics do.
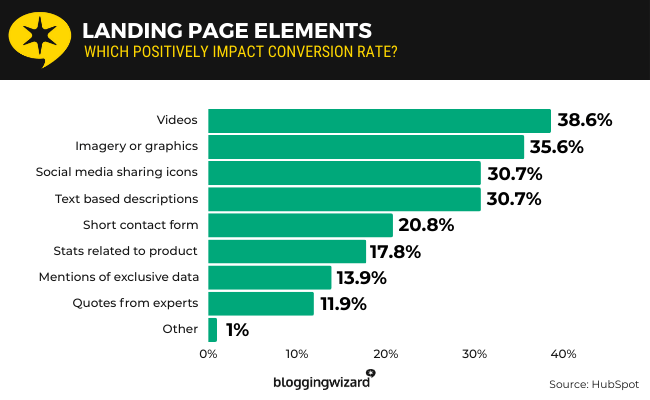
Here are the rest of the results:
- Videos – 38.6% of marketers say this sort of content has the greatest impact on conversions for landing pages
- Imagery or graphics – 35.6%
- Social media sharing icons – 30.7%
- Short, text-based descriptions of the landing page offer – 30.7%
- Short contact forms – 20.8%
- Statistics related to the topic or product – 17.8%
- Mentions of exclusive data, interviews or product access – 13.9%
- Quotes from experts about the offer or product – 11.9%
1% of marketers voted “other,” but HubSpot didn’t provide any write-in responses.
Source: HubSpot1
17. A red call to action button may increase conversions by as much as 34%
According to case studies conducted in cooperation with CXL in which participants tested green CTAs against red CTAs, the red button outperformed the green button by 20% on average.
The first case study came from Dmix. After 600 conversions, they noticed their red “Get Started Now” button increased conversions by 34%.
The second case study came from HubSpot. After 2,000 visits, their red “Get Started Now” button increased conversions by 21%.
However, CXL did point out that the majority of HubSpot’s web page design was green already, so the red CTA stood out more.
The third case study came from VWO. Their red “INFO” button increased conversions by 5%.
Source: CXL
Statistics on landing page strategies
18. 51.5% of marketers drive traffic to their landing pages through social media promotion
According to HubSpot’s survey of marketers, 51.5% of marketers drive traffic to their landing pages by promoting them on social media.
43.6% use email marketing while 35.6% use SEO marketing.
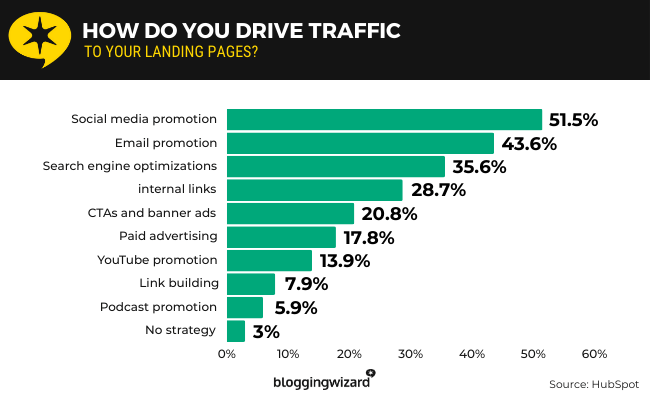
Here are the full results:
- Social media promotion – 51.5% of marketers use this strategy to promote their landing pages
- Email promotion – 43.6%
- Search engine optimization – 35.6%
- Internal links in blog posts – 28.7%
- CTAs and banner ads – 20.8%
- Paid ads – 17.8%
- YouTube promotion – 13.9%
- Link building on referring sites and domains – 7.9%
- Podcast promotion – 5.9%
3% of marketers do not have a strategy for promoting landing pages.
Source: HubSpot1
19. A lead magnet helped a small entrepreneur generate 3,600 leads
According to a case study conducted on small entrepreneur Laurie Wang by landing page application Leadpages, Laurie was able to generate more than 12,000 leads after using Leadpages to design her landing pages.
The case study goes on to explain how 3,600 of those leads, or roughly 30%, originated from a single lead magnet, which was a guide that teaches marketers how to plan and organize their social media calendars.
As for design, Laurie uses multiple landing pages for different marketing goals and lead magnets. She also heavily relies on Leadpages’ popup element.
Source: Leadpages1
20. Placing key content in their landing page’s hero section helped ClickMechanic increase conversions by 15%
When ClickMechanic, a hub for the car repair and maintenance service industry, used heatmap tool Hotjar to determine ways in which they could optimize their primary landing page, they discovered that the majority of their visitors never scrolled past the page’s hero section.
So, when they redesigned their page, they decided to focus on the hero section by placing the page’s most important functionality, a quote form, in the hero section itself.
The result was an immediate 15% increase in conversions.
Source: Hotjar
Statistics from landing page applications
21. Leadpages users generated more than 65 million conversions in 2023
According to landing page builder Leadpages’ annual report, its user base generated 65,603,277 conversions in 2023.
These conversions were generated from 584,840,730 views, which means Leadpages users had an average conversion rate of 11.22% in 2023.
Source: Leadpages2
22. Leadpages has been used by more than 434,000 entrepreneurs since it launched
According to Leadpages’ annual report, the landing page application has been used by more than 434,000 entrepreneurs since it launched in 2013.
Plus, according to the company’s own metrics, more than 270,000 businesses have been launched on Leadpages.
Source: Leadpages2
23. Instapage customers have generated more than 500 million conversions
Instapage customers have generated more than 500 million conversions since the company was founded in 2012.
These conversions were generated by over 15,000 companies who created more than 3 million landing pages and accrued over 4 billion visits.
Instapage’s customers include Airbnb, Verizon, HelloFresh, Vimeo, SoundCloud and SurveyMonkey.
Source: Instapage
Local landing page statistics
24. 76% of the top local landing pages are homepages
Nifty conducted a study on the top landing pages from the top ranking websites from 50 of the largest metros in the United States.
They discovered that although 86% of the top local landing pages are mobile friendly, the majority, or 76%, are homepages.
Source: Nifty
25. 76% of the top local landing pages on Google have a location in the title tag
According to Nifty’s research, 76% of the top local landing pages on Google have a location in the page’s title tag.
66% have their business name in the title tag.
Another 58% have their business’ location or a keyword related to their business in the title tag of their Google Business Profile listing.
Source: Nifty
26. 37% of the top local landing pages have testimonials
Nifty’s analysis of the top local landing pages on Google from businesses in 50 metro areas in the United States included details on the content of these pages.
They discovered that 37% of the top local landing pages include testimonials from customers.
31% address frequently asked questions on landing pages while 25% have videos.
Source: Nifty
27. The average word count of a top local landing page is 653
According to Nifty’s analysis, the average top local landing page has 653 words.
Only 7% used keywords in the page’s H1 heading.
Source: Nifty
Sources
Final thoughts
That concludes our list of landing page statistics. We learned quite a few things about landing pages from these statistics, especially how to optimize our own landing pages.
For starters, not only should we create landing pages for different campaigns, we should also create more landing pages in general.
Try to create one landing page for each lead magnet, product and service you offer. You can even create multiple landing pages for the same product or service, especially if you want to focus each one on a different section of your target audience.
Check out our guide on optimizing landing pages for more help with this.

