12 Best Heatmap Software Tools Reviewed For 2024

Want to improve CRO on your website? You’re going to need the best heatmap software to help you.
Heatmaps are an extremely effective way of understanding how users behave on your website. With this type of digital analytics data, you can improve user experience and drive more conversions.
In this post, we’ll compare the best heatmap tools to help you easily generate heatmaps for your website.
The best heatmap software tools – summary
TL;DR:
- Mouseflow – Best overall heatmap software.
- Instapage – Powerful landing page builder with built-in heatmaps.
- Lucky Orange – Best real-time heatmap tracking tool.
- VWO – Best heatmap tool with built-in A/B testing.
- Hotjar – Powerful heatmap software tool.
- Clicky – Simple and affordable all-in-one heatmap and analytics software.
- Zoho PageSense – Great conversion optimization and personalization platform.
- Crazy Egg – Powerful website improvement toolkit.
- Plerdy – Best value heatmap tool.
- Attention Insight – Best heatmap software powered by AI heatmaps.
- Inspectlet – Customer journey mapping tool with dynamic heatmaps.
- Smartlook – Analytics-focused heatmap software tool.
1. Mouseflow
Mouseflow is one of the best heatmap tools designed to help you uncover patterns in users’ website behavior and website performance. With Mouseflow, you can easily create scroll, click, attention, geographical, and movement heatmaps to connect the dots and take all guesswork out of the picture.

What’s more, you can see your visitors in action using the Session replay tool. The tool shows you exactly what your users are up to when visiting your website and provides automatic Friction Scores to help you decide which areas to focus on first.
Mouseflow also allows you to create custom funnels, recover abandoned forms with form analytics, and glean useful feedback with feedback campaigns.
Mouseflow essentially helps you inform all your organizational functions, from marketing and analytics to product and design. It even integrates seamlessly with your CMS, e-commerce, and marketing platforms.
Pricing
Mouseflow is available as a free heatmap software, allowing recording for 500 user sessions a month. Paid plans start from $24 a month and can go up to $399 per month.
You can also opt for a 14-day free trial for any of its paid plans.
2. Instapage
Instapage is one of the best landing page builders on the market. What’s unique about this platform is the heatmap software that is included – no need to pay for multiple tools to run your lead generation campaigns.
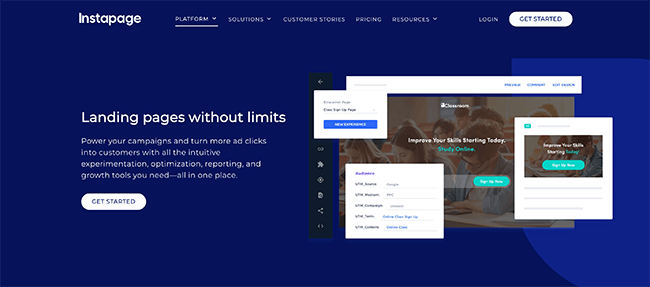
You can create detailed heatmaps for your website visitors and even leverage A/B testing, multivariate testing, and powerful analytics tools to optimize your landing pages.
Instapage offers you the tools to customize landing pages for visitors to an extent not seen before. By analyzing how users interact with your website, it allows you to create unique landing page experiences for every target audience.
You can also visualize your ad campaigns with AdMap and connect users to relevant post-click landing pages every single time, greatly increasing engagement and conversions.
Instapage also helps you load your web pages faster and collaborate better with your team members.
Pricing
A 14-day free trial is available. Paid plans start at $299/month. Save 25% with an annual subscription.
3. Lucky Orange
Lucky Orange is a heatmap tool that focuses on conversion rate optimization. With its robust tools like dynamic heatmaps, session recordings, conversion funnels, and more, it acts as an all-in-one suite for boosting conversions.
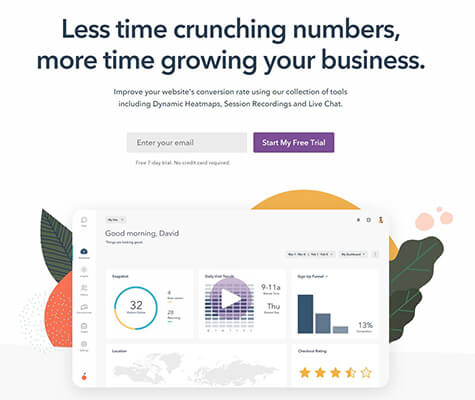
Lucky Orange is one of the best heatmap software tools out there, thanks to its real-time dynamic heatmaps offering detailed insight into users’ website behavior. You can track the performance of individual page elements as well for even better optimization.
The session recordings feature allows you a peek into the exact actions your visitors are taking on your website so you can find what’s stopping them from converting.
And with conversion funnels, form analytics, live chat, and surveys, you can further obtain invaluable data on what makes your users click and what isn’t working.
Pricing
Lucky Orange offers a free plan with a limit of 500 page views a month. You can opt for their paid plans starting from $18 a month.
There’s also a 7-day free trial available for each one of their plans.
4. VWO (Visual Website Optimizer)
VWO or Visual Website Optimizer is one of the top heatmap software on the market and also a great A/B testing tool that allows you to experiment with multiple landing page ideas easily and at speed.

VWO Insights helps you capture real-time behavioral data using detailed heatmaps that demonstrate the elements that attract user attention.
Insights also provides session recordings so you’re able to visually pinpoint why certain users aren’t converting and identify opportunities for testing various strategies with specific user segments.
And with Funnels, you can identify conversion leaks for existing customer segments and discover new segments with advanced segmentation capabilities.
Combining all these tools with other key features like form analytics, surveys, and detailed customer analytics, you’ll find yourself armed with a potent arsenal to improve experimentation and consequently, conversions.
With its powerful A/B testing and multivariate testing tools, VWO enables you to perform smart and fast experimentation with your landing pages and identify the best opportunities for website optimization and user conversion.
Pricing
Pricing for VWO plans is available on request. You’ll have to choose your plan and contact them for the respective prices. A 7-day free trial is available, though.
5. Hotjar
Hotjar is one heatmap tool that focuses on exactly that—heatmaps. Unlike many tools on this list, Hotjar is exclusively a heatmap software that helps you visualize user behavior and see what users interact with on your website.
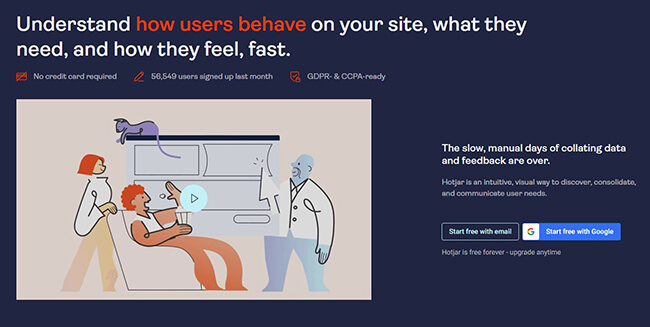
Hotjar allows you to create click, move, and scroll heatmaps to uncover where your users are focusing the most and which areas they’re ignoring. You can also segregate heatmaps by the device to determine how user interaction gets affected by desktop, tablet, and mobile use.
In addition to its detailed heatmaps, Hotjar also allows you to view real-time user interaction using Recordings. You can visualize complete user journeys and spot pain points on your website that need to be worked on.
Hotjar lets you download your heatmaps and share them with relevant stakeholders. You can also leverage its survey and feedback tools to capture first-hand data from your users and uncover even more insights.
Hotjar is a great tool for product designers, product managers, and researchers who want to better understand their target segment and develop better products for them.
Pricing
Hotjar is a free heatmap software, limited to 1,050 sessions a month. Paid plans start from $39 a month. All Hotjar plans come with a 15-day free trial and a 30-day money-back guarantee.
6. Clicky
Clicky is best known as a real-time web analytics tool with a heatmap tracking feature that’s quite popular among marketers and web designers. Clicky helps you monitor, analyze, and action your web traffic in real time.
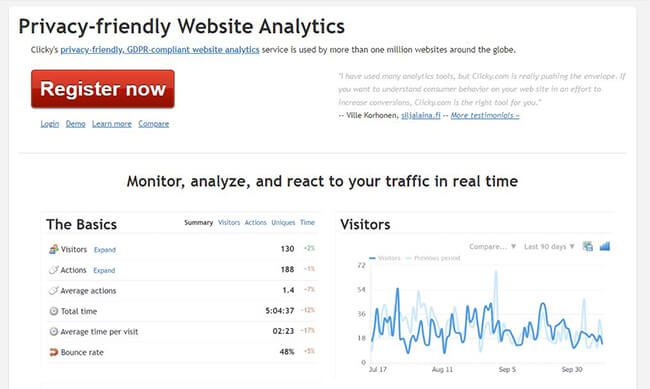
Clicky brings a simple but detailed approach to heatmap analytics that’s great for people starting to get into website optimization. It allows you to analyze your visitor behavior in an easy-to-grasp manner and successfully use the insights obtained to boost conversions.
With Clicky, you can segment your clicks based on targeted criteria, say, a specific user action. You can then track your users based on which ones completed that specific goal versus those who didn’t.
Clicky also places a great deal of importance on privacy and GDPR compliance. You can also see every visitor, pageview, and javascript event with its visitor and action logs.
Clicky offers a razor-sharp focus on web analytics combined with a simple yet powerful heatmap analysis solution.
Pricing
Plans for Clicky start from $9.99 a month. There’s also a free plan available.
7. Zoho PageSense
Zoho PageSense is a conversion optimization and personalization platform that also offers a powerful heatmap tool. It offers you all the tools necessary to track, analyze, and optimize your website by engaging your visitors and personalizing landing pages for each of them.
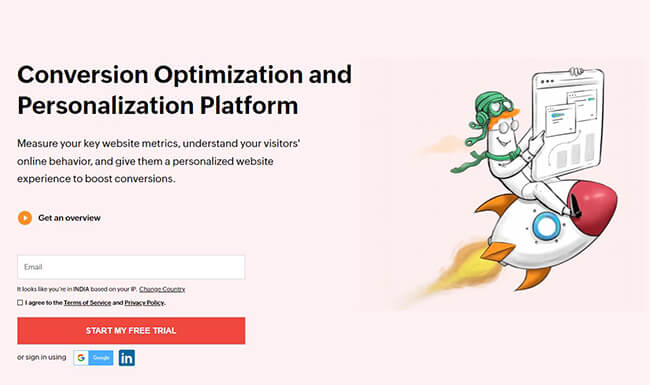
With the heatmap tools provided by Zoho PageSense, you can gain insight into the areas of your website receiving the most attention from your visitors. You can use this analysis to optimize your website further to increase engagement.
And combining this with session recordings, you can enhance your web traffic analysis by viewing session replays of users’ behavior on your website.
PageSense also allows you to track key website metrics and monitor where visitors are dropping off by building conversion funnels. With A/B testing, you can then optimize every element of your website to experiment with different design layouts and see what works.
You can even run in-app polls, on-site surveys, and more to get crucial data from your visitors and create personalized experiences for them.
Pricing
Paid plans start from around $15 a month for 10,000 monthly visitors. You can also opt for a 15-day free trial.
8. Crazy Egg
Crazy Egg offers a host of tools for making your website better, including heatmaps, session recordings, A/B testing, traffic analysis, and surveys. It provides solutions tailored for agencies, lead gen, e-commerce, and more.
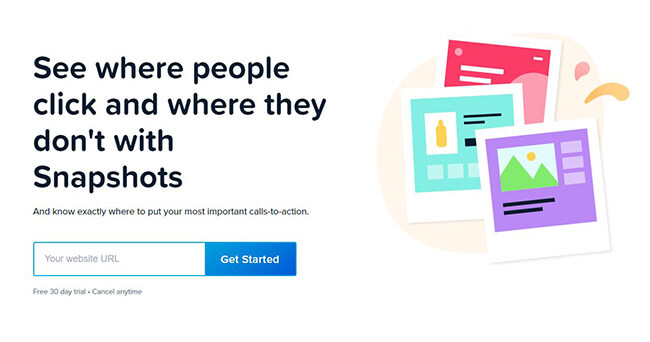
Crazy Egg’s heatmap tool, Snapshots, allows you to analyze visitor behavior on your website with the help of multiple reports like a scroll map report, confetti report, overlay report, and more. These reports allow you to decide where to put important elements on your website like CTAs.
With Recordings, customer journey mapping is a breeze, allowing you to see exactly how visitors interact with your website in real time. You can determine which sections of your website are avoided by visitors and how much they spend on your website.
You can also take advantage of A/B testing to see various strategies in action using a simple, no-code testing environment that is quick to set up.
Crazy Egg also allows you to analyze your web traffic from different sources, compare them and optimize your website with smart, data-backed decisions. You can also run targeted surveys that can help you gather crucial feedback and boost engagement.
Pricing
Paid plans for Crazy Egg start from $29 a month, billed annually. They also offer a 30-day free trial for each of their plans.
9. Plerdy
Plerdy is one of the best options for those looking for the best free heatmap software. What exists as a conversion rate optimization platform to help you track, analyze, and convert visitors into buyers, also offers a range of powerful website heatmap tools for optimizing your website.
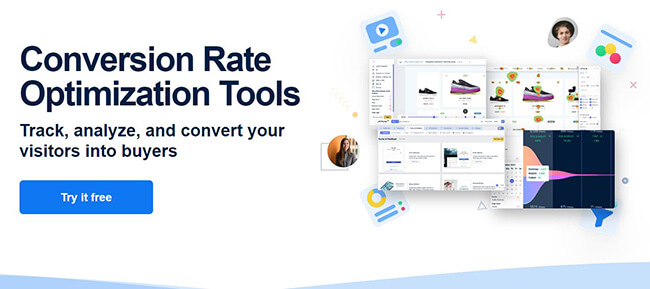
Plerdy allows you to unlock deep insights into the actions of website visitors like clicks, mouse movement, hovering, and scroll behavior. You can improve your website performance by uncovering design flaws, analyzing individual design elements, and improving bounce rate.
Plerdy also provides you with pop-up forms that can be generated on necessary webpages to inform visitors about promotions, capture e-mail addresses, and improve engagement. Plerdy also provides an SEO checker and a conversion funnel analysis tool.
You can even use its session recording tool to capture site behavior for individual users. And with its feedback forms, you can obtain first-hand user feedback and measure metrics like Net Promoter Score.
Pricing
Plerdy can be used for free with its limited plan. Paid plans start from $26 a month. There’s also a 14-day free trial available for each of the paid plans.
You can use Plerdy’s tools free of cost for up to 3 heatmaps a day, making it a great heatmap software tool for users with small businesses and limited budgets.
10. Attention Insight
Attention Insight is an AI-based web design improvement tool that allows you to test your website even before launch, right during the design phase. Its predictive tests show you how visitors will interact with your website when you eventually launch it.
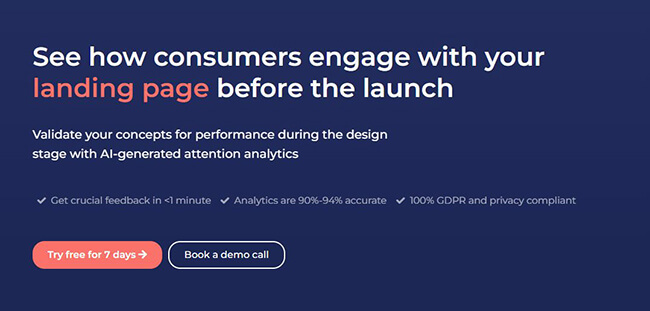
Attention Insight uses predictive attention heatmaps to showcase your website performance in the design phase itself, so you don’t need to wait till after the launch, after having invested time and money to bring traffic to your website.
Its AI-powered platform predicts with 94% accuracy, how well your website design will resonate with your target audience. You can also optimize for different types of content like marketing material, packaging, posters, and more.
You even have access to key features like Percentage of Attention to see how well a subset of your website will perform. And with Focus Map, you can instantly see which parts of your website are noticed or missed by users within the first 3-5 seconds.
Attention Insight also gives a Clarity score for your website that indicates how clear your website design is for a new user. This is derived after comparing your website against competitors in your category.
Pricing
Paid plans start from $23 a month. You can also start using its free plan, limited to 5 map designs a month. There’s also a 7-day free trial available.
11. Inspectlet
Inspectlet is a customer journey mapping tool that helps you track mouse movements and scroll behavior of visitors on your website. It’s a heatmap software that’s geared toward uncovering deep insights into how users are interacting with your website.
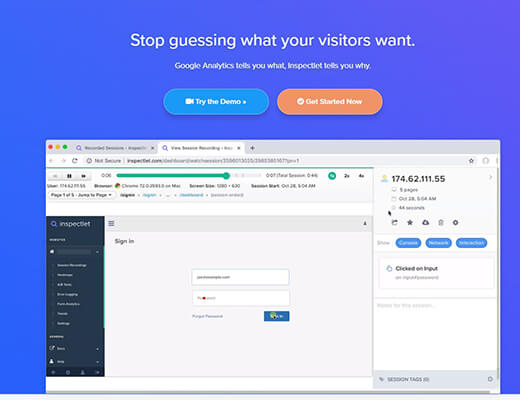
Inspectlet’s dynamic heatmaps let you track the entire journey of your visitors on your website, from clicks to mouse movements and scrolling behavior. You can decide where to put the most important elements on your web pages by analyzing these reports.
With Session Recording, you can replay recordings of individual users interacting with your website. And with a set of powerful filters, you can find exactly the users you’re looking for.
Inspectlet also provides features like funnel analysis, A/B testing, feedback surveys, and form analytics to help you gather even more data on every segment of users landing on your website.
Pricing
Inspectlet offers a free forever plan limited to 2,500 recorded sessions a month. Paid plans start from $39 a month.
12. Smartlook
Smartlook is an easy-to-use but powerful heatmap software tool that focuses on combining heatmaps and session recordings with event-based analytics.
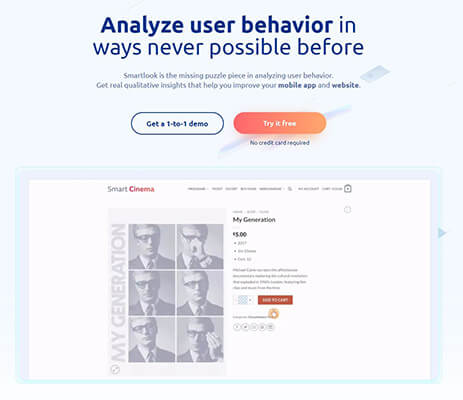
Smartlook provides powerful heatmaps that help you visualize how visitors are moving across your website. It provides click maps, scroll maps, and movement maps for you to understand exactly which elements of your website perform. You can also download and share heatmaps with relevant team members.
You can also view session replays to see where your visitors are getting stuck on your website and uncover bugs that are hindering site performance.
With event analytics, you can see if users are performing actions that you want them to. Events like URL visits, button clicks, text inputs, and more can help you build a complete picture of how individual users interact with your website.
Smartlook also allows you to use Funnels to see where exactly users are dropping off with powerful funnel analysis.
Pricing
Smartlook provides a free forever plan limited to 1,500 sessions a month. Paid plans start from $39 a month. There’s also a 10-day free trial available for each of the paid plans.
What is the best heatmap software tool?
That’s all for our list of the best heatmap software tools. Although each one of the tools discussed packs a punch, our best picks of the list would be:
Mouseflow is our #1 pick for the best overall heatmap tool on the market. It combines a variety of heatmaps, session recordings, and deep analytics to help you extract the most from your website.
Clicky represents one of the most simple and affordable approaches to web analytics and heatmap tracking. Its powerful segmentation filters allow you to find exactly what you’re looking for when analyzing your visitor behavior.
Attention Insight stands out from the rest due to its AI-powered predictive heatmaps that can save you time and money when launching your new website. Being able to predict visitor behavior right in the design phase can come as a boon for many business owners.
Final thoughts
There are various types of CRO tools on the market. But heatmap software is one of the most important.
One study has shown that when you invest in CRO techniques such as heatmaps, you may see an increase of ROI by 30%.
Heatmaps and CRO in general will help you to find problematic areas of your website that are causing you to lose sales. When implemented correctly, you’ll simultaneously improve UX and sales.
Disclosure: Our content is reader-supported. If you click on certain links we may make a commission.
