45 Latest Smartphone Statistics For 2024: The Definitive List

Modern consumers are addicted to their smartphones. We take them with us everywhere we go and spend an increasingly large portion of our days browsing the web, watching videos, and shopping on our smartphones.
In this mobile-first economy, it’s important for marketers to understand how customers are using their smartphones and to use this knowledge to guide their mobile marketing strategy.
With that in mind, we’ve put together a list of the latest smartphone statistics that every marketer should know.
These stats will reveal the state of the smartphone industry this year, uncover useful insights about smartphone users, and reveal the apps and trends that are shaping the future of mobile.
Editor’s top picks – smartphone statistics
These are our most interesting statistics about smartphones:
- There are almost 6.4 billion smartphone users worldwide. (Source: Statista2)
- Smartphone use is greatest in the early morning and late evenings. (Source: comScore2)
- 48% of marketers say optimizing for mobile is one of their SEO tactics. (Source: HubSpot)
General smartphone statistics
Let’s start with some general smartphone statistics that show just how popular smartphones are this year.
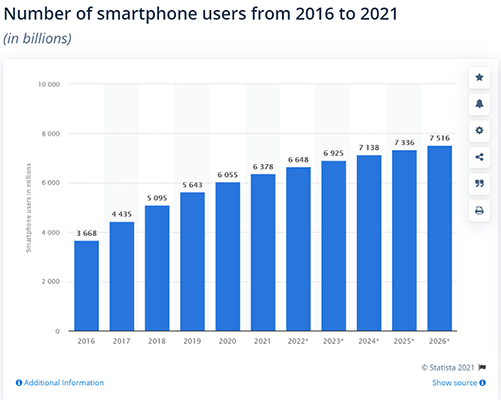
1. There are almost 6.4 billion smartphone users worldwide
That’s up from a little over 6 billion in 2020. That figure has also almost doubled since 2016 when the number of smartphone users stood at just over 3.6 billion, which just goes to show how quickly the smartphone market has grown.
Source: Statista2
2. There will be 7.5 billion smartphone users by 2026
Despite the fact that the majority of people on earth already own a smartphone, there’s still room in the market for growth. It’s estimated that over the next 5 years, the number of users will increase by over 1 billion to a total of 7.5 billion. This growth will be driven in no small part by increasing smartphone adoption in emerging economies.
Source: Statista2
3. Around four-fifths of all mobile handsets are smartphones
A decade ago, smartphones were a lot rarer than they are now, and feature phones were much more common. But in the last year, hundreds of millions of people upgraded, and around 80% of mobile handsets are now smartphones.
Source: Datareportal
4. There were over 6 billion smartphone subscriptions in 2020
This is forecast to reach 7.69 billion by 2026. The smartphone industry as a whole is heavily reliant on a subscription model, in which users pay a mobile service provider a monthly fee in exchange for a package that typically includes the smartphone device plus a monthly data allowance.
Source: Ericsson
5. Smartphones account for 70% of total digital media time in the US
Digital media includes videos, music, podcasts, apps, audiobooks, web articles, and any other form of media content that can be submitted digitally. 70% of all the time spent with digital media content happens on smartphones.
Source: comScore1
6. Smartphones and other mobile devices account for over half of all global web traffic
Over the last few years, the share of global web traffic has been more or less split equally between desktop and mobile. It’s hovered around 50% for a while but in the first quarter of 2021, 54.8% of global traffic came through mobile devices (not including tablets).
In the future, we may see mobile devices account for an even greater share of web traffic. For marketers, the takeaway from this is clear: optimize your website and content for smartphone viewing, as you can bet your bottom dollar a big chunk of your target customers will be using them.
Source: Statista3
Smartphone usage statistics
Next, let’s take a look at some smartphone statistics that tell us more about the ways in which people use their mobile devices.
7. 80% of Americans check their smartphones within 10 minutes of waking up
Whether it’s to turn off the alarm clock, check the weather, open our emails, or call in sick for work, the first thing most of us do when we wake up in the morning is to reach for our smartphones.
Email marketers might want to leverage this tendency by sending out promotional emails early in the morning. That way, it will be right at the top of your customer’s inbox when they first open up their email apps on the smartphone after waking up.
Source: Reviews
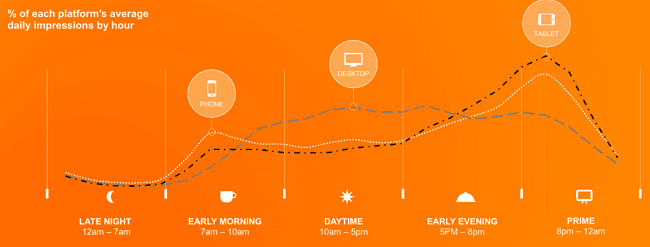
8. Smartphone use is greatest in the early morning and late evenings
ComScore also looked at how people use their devices across the day and found that while desktops dominated during the daytime (10 am to 5 pm) – the period during which people are usually in the office – smartphones were used more often in the early morning (7 am to 10 am) before the average person sets off on their commute.
Smartphone usage (as well as tablet usage) also overtakes desktop again as we move towards late evening (8 pm to 12 am). If you’re planning on reaching customers on their smartphones, these are the times of day you might want to focus your efforts on.
Source: comScore2
9. The average American checks their phone 262 times per day
It seems that as a society, we really are addicted to checking our phones. We check it a whopping 262 times every day, which works out at around once every 5.5 minutes.
Source: Reviews
10. Americans spend more time on their smartphones than watching live TV
The average person in the US spends 4 hours on their mobile device every day, compared to 3.7 hours watching TV. And across different countries, the average daily time spent on mobile in 2020 was 4 hours 10 minutes, which is up 20% since 2019. This reflects a larger shift in consumer preferences, with users gravitating increasingly towards smaller screens.
Source: App Annie1
11. Over three-quarters of worldwide video viewing happens on mobile devices
eMarketer estimated that 78.4% of digital video audiences globally watch video content on their smartphones. If you’re creating video content, make sure it’s optimized for viewing on smaller screens.
Source: eMarketer1
Related Reading: 60 Video Marketing Statistics You Need To Know.
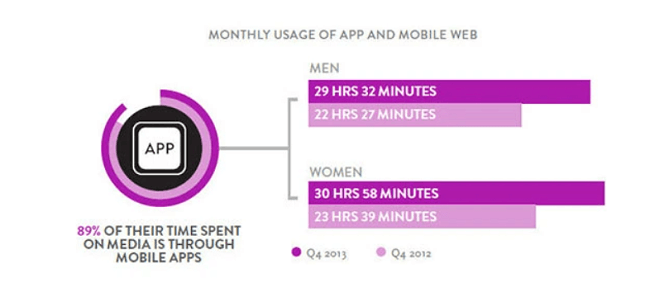
12. Smartphone users spent 89% of their time on apps
According to data from 2013 (which may be outdated by this point), apps account for 89% of total mobile media time while the other 11% is spent on websites.
Source: Nielsen
Smartphone user demographics
Which segments of the population are the most prolific smartphone users? Let’s find out by taking a look at some smartphone statistics related to user demographics.
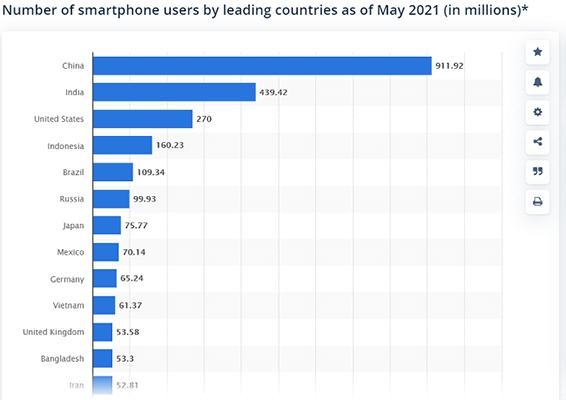
13. There are more smartphone users in China than in any other country
Perhaps unsurprisingly given that it’s the most populated country on earth, China tops the chart when we look at smartphone users by country, with over 911 million users.
India comes in second place with over 439 million smartphone users. Interestingly, this is less than half that of China, despite the fact that India has a very similar population count (around 1.34 billion compared to China’s 1.4 billion).
Source: Statista4
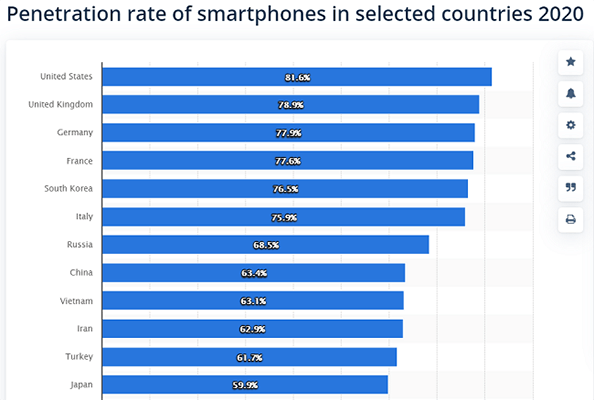
14. The US is the country with the largest smartphone penetration rate
There are around 270 million smartphone users in the US compared to a population of around 328 million. This works out to be around 81.6% of the population, making the US the country with the greatest smartphone penetration rate.
Unsurprisingly, the top 5 countries by penetration rate are all countries with developed economies. The UK, Germany, France, South Korea, and Italy all have a penetration rate of over 75%. The relatively low penetration rate of smartphones in developing countries like India (31.8%) and Pakistan (18.4%) is why there’s still plenty of room for growth in the market.
Source: Statista5
15. 75.1% of web traffic in Nigeria goes through mobile
Nigeria ranks first if we look at the share of mobile traffic (compared to desktop) by country. Vietnam is the country with the lowest mobile share of web traffic: only 19.3% of web traffic in Vietnam went through mobile in 2020, compared to over 80% on desktop.
Source: Statista6
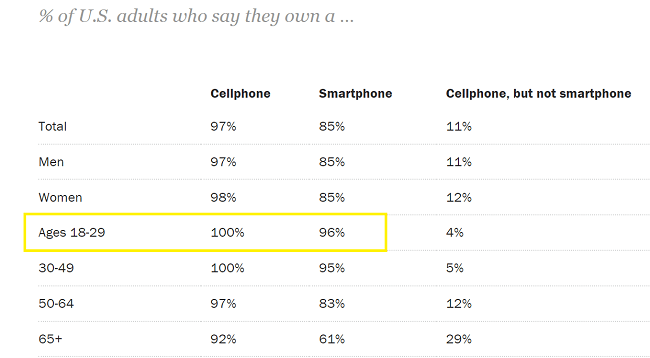
16. 96% of 18 to 29-year-olds in the US own a smartphone
The vast majority of Americans own some kind of mobile phone, but smartphone ownership varies significantly across age groups. 96% of those aged 18-29 own one compared to just 61% of those aged 65+.
Source: Pew Research
17. Gen X and Baby Boomers spent 30% more time on smartphone apps in 2020
Year-over-year growth of time spent on smartphone apps is up across all demographics, but particularly amongst older generations. In the US, Gen Z spent 18% more time on their most-used smartphone apps last year, compared to 18% of Millennials, and 30% of Gen X and Boomers.
Source: App Annie1
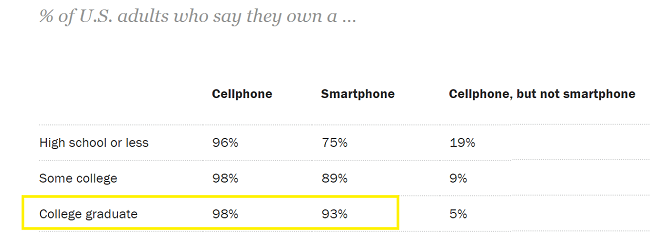
18. 93% of college graduates in the US own a smartphone
Smartphone ownership seems to correlate strongly with education. 93% of college graduates own one, compared to just 75% of those with a high school education or less.
Source: Pew Research
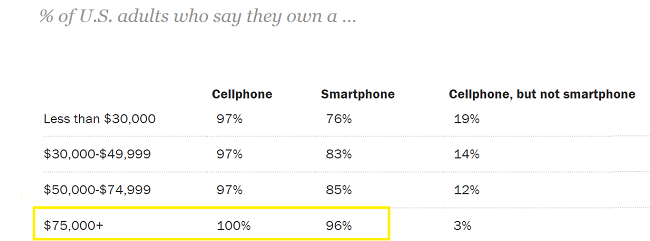
19. 96% of US citizens who earn $75,000+ own a smartphone
In addition to education, smartphone ownership also seems to correlate with average income. 96% of top earners own a smartphone device compared to only 76% of those who earn under $30,000 per year.
Source: Pew Research
20. Women spend longer on smartphone apps than men
Women spend 30 hours 58 minutes on their favorite apps on average. In comparison, men spend just 29 hours 32 minutes on their favorite apps. It’s worth noting, though, that this data comes from 2013 and might be a little outdated.
Source: Nielsen
Smartphone sales statistics
Which smartphone brands and device models are the most popular? And just how large is the smartphone market? Here are some smartphone sales stats that answer those questions and more.
21. Global revenue from sales of smartphones came to around 409 billion in 2020
While that’s obviously a huge figure, it’s not as high as you might expect if you compare it to the year before, when sales generated around 522 billion in revenue. This year-over-year drop in revenue suggests the smartphone market has reached a plateau and might now be in decline.
Source: Statista7
22. The average smartphone costs $317 USD
If you’re from the US, this is probably a lot lower than you’d expect. The reason it’s so low is that this is the average sales price worldwide.
While it’s not uncommon for the latest smartphone models to have price tags of $1000 or more, there are still many older, cheaper phones in the market in regions of the world with weaker economies, such as Latin America, where affordable smartphones are more popular.
For example, 58.5% of all smartphones sold in Q2 2019 in Latin America cost under $199. This brings the average global cost down and goes some way towards explaining the $317 figure. It’s also worth noting that the average smartphone cost is actually up by $35 since 2016
Source: Statista8
23. Samsung is the most popular smartphone brand (by shipments)
The Korean brand was the market leader in 2020, accounting for 20.6% of all smartphone shipments. Apple came in second place, with a 15.9% market share.
Source: Statista9
24. The Apple iPhone 12 Pro Max is the most popular smartphone model in the US
It accounted for 13% of all smartphone sales in the US in 2021. Combined, all iPhone models made up about 36% of sales.
Note that this is accurate as of April 2021 but it’s probable that it will change over time. At the time you’re reading this, new models may have already surpassed the iPhone 12 Pro Max.
Source: Statista10
Smartphone statistics for marketers
Below, we’ve curated some smartphone statistics that marketers and businesses might find useful.
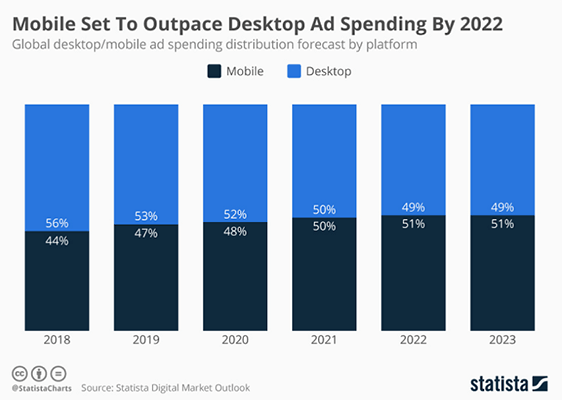
25. Mobile advertising will outpace desktop advertising by next year
According to forecasts published on Statista, mobile ad spending will account for 51% of total ad spending by 2022, compared to 49% on desktop ads. In 2021, ad spending is split roughly equally between desktop and mobile.
Source: Statista1
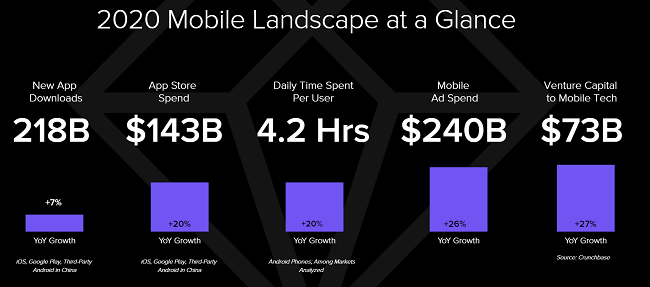
26. Mobile ad spend reached $240 billion in 2020
That’s up by 26% year over year and offers further evidence of the rapid growth of mobile advertising.
Source: App Annie1
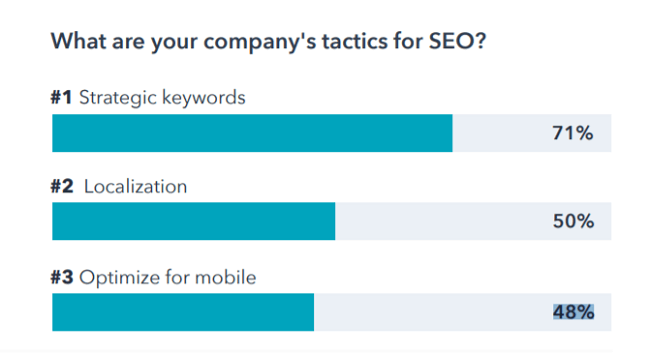
27. 48% of marketers say optimizing for mobile is one of their SEO tactics
When asked about their SEO tactics, almost half of all marketers in a survey by HubSpot reported that they were optimizing content for mobile. As the global consumer base spends more and more time on smaller screens, the importance of mobile optimization for marketers can’t be understated.
Source: HubSpot
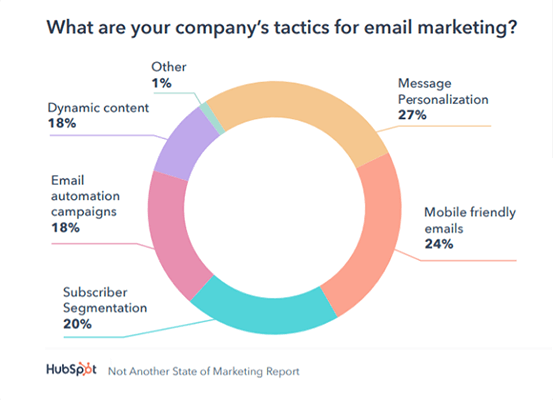
28. 24% of marketers are prioritizing mobile-friendly emails
When asked what their company’s tactics for email marketing are, 24% of respondents in the same survey answered ‘mobile-friendly emails’. This was the second top response and came just behind message personalization, which accounted for 27% of responses.
Source: HubSpot
29. The average e-commerce conversion rate for mobile phone users is 2.12%
If you’re running an ecommerce store, this is a useful benchmark to measure your own performance against. Interestingly, people seem to be less likely to convert on mobile compared to other devices. The average conversion rate on both desktop and tablet was greater than on mobile, at 2.38% and 3.48% respectively.

Source: Kibo
30. The average e-commerce order value on purchases made via mobile is $84.31
Again, mobile lags behind both desktop and tablet here, where the average order value is $122.11 and $89.11 respectively. The reason why people spend less on mobile is up for debate, but it may be that prospective buyers find it harder to gather all the information they need to make a purchase decision on a smaller screen.

Source: Kibo
31. 72.9% of ecommerce sales happen through mobile devices
Despite the fact that consumers convert less readily and spend less on mobile, the vast majority (72.9%) of ecommerce purchases still happen on mobile. This is up from 52.4% in 2016.
If you’re curious to learn more, check out our roundup of ecommerce statistics.
Source: Oberlo
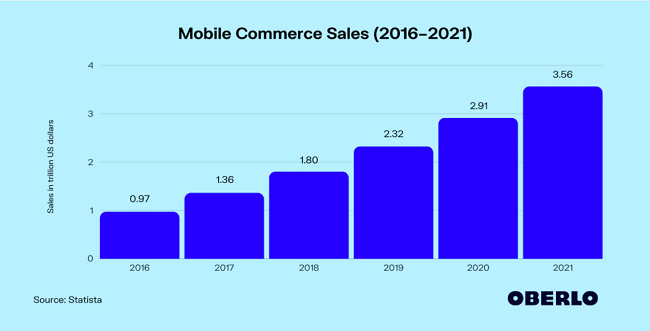
32. Mobile commerce sales are estimated to reach $3.56 trillion in 2021
That’s 22.3% more than 2020 when sales reached $2.91 trillion, and it shows just how huge the mobile commerce market is. Those kinds of figures are tough to get your head around.
Source: Oberlo
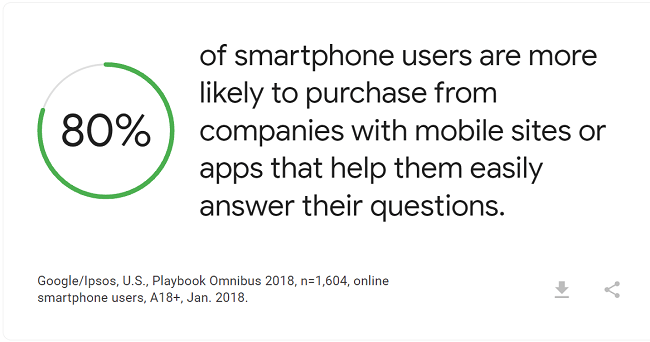
33. 80% of smartphone users are more likely to buy from brands with mobile-friendly sites or apps that help to answer their questions
The upshot: If you want to make more sales, make sure your website is mobile-friendly so that it’s easy for your customers to access your FAQs and gather all the information they might need to make a purchase.
Source: Think with Google
34. 88% of people who access coupons and incentives will only do so on mobile
Marketers can adapt to this consumer habit by listing their coupons and promotional offers on mobile discount apps.
Source: comScore3
35. 83% of people who use social media instant messaging platforms will only access them on mobile
If you’re running a social media marketing campaign or using instant messaging apps as a customer communication channel, this is worth taking note of. Other popular mobile-only app categories included weather (82%) and dating (85%).
Source: comScore3
36. Two-thirds of shoppers will check their smartphones in-store for product information
69% of shoppers prefer to look for customer reviews on their smartphones before speaking to a store associate when researching products. 59% also prefer to shop around for similar products before speaking to an associate, and 55% would rather find product specifications on their smartphones than ask someone in-store.
Source: eMarketer2
Smartphone app statistics
Next, let’s take a look at some statistics about the smartphone app market.
37. There were 218 billion new smartphone app downloads in 2020
This data takes into account downloads across iOS, Google Play, and Third-Party Android in China. It’s up 7% year over year.
Source: App Annie1
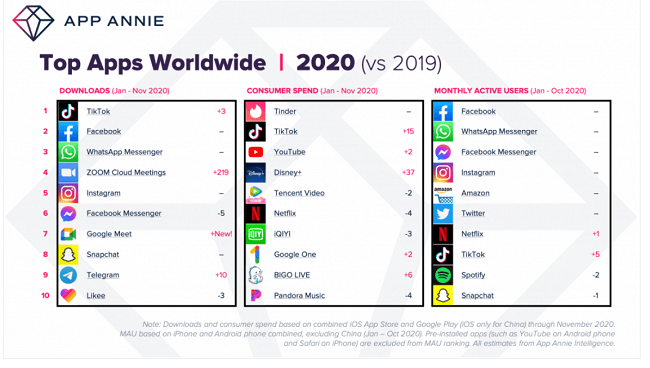
38. TikTok was the most downloaded smartphone app of 2020
It’s been a great couple of years for TikTok. The social network has gone from strength to strength and achieved the most downloads in a single quarter of all time in 2020.
Source: App Annie2
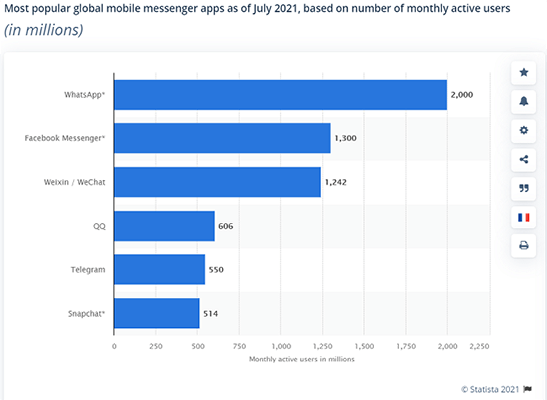
39. WhatsApp is the most popular smartphone messaging app
2 billion people use WhatsApp monthly, compared to 1.3 billion on Facebook Messenger, 1.24 billion on WeChat, and just 514 million on Snapchat.
Source: Statista11
40. $143 billion was spent in app stores in 2020
Again, that includes money spent across various platforms including iOS, Google Play, and Third-Party Android in China.
Source: App Annie1
41. 97% of publishers earn less than $1 million per year through the iOS App Store
Despite the huge size of the paid app market, the vast majority of publishers who monetize through the app store don’t make 7 figures.
Source: App Annie1
Miscellaneous smartphone statistics
Before we wrap up, here’s a handful of statistics that didn’t fit in any other category, but that we still thought you might find interesting. Enjoy!
42. Over 50 million foldable smartphones will be shipped in 2022
Foldable smartphones are an emerging trend and might represent the next evolution in smartphone tech. Only 1 million were shipped in 2019, but as the technology becomes more common and more foldable models enter the market, that figure is expected to rise quickly. According to estimations from analysts, 50 million are expected to be shipped next year
Source: Statista12
43. More than 99% of smartphones run iOS or Android
Android controls the largest market share at 73%, with Apple’s iOS coming in second at 26%.
Source: Statista13
44. Saudi Arabia is the country with the fastest 5G download speeds
On average, smartphone users in the country achieve a download speed of 354.4 Mbps. UAE comes in second place, with an average download speed of 292.2 Mbps.
Source: Statista14
45. 13% of the world don’t have access to electricity (and so would struggle to charge their smartphones)
Despite the fact that 6.4 of the 7.9 billion people on earth reportedly have a smartphone, 13% of the global population (around 1 billion people) don’t even have access to electricity which means that even if they had a smartphone, they would find it difficult to charge it.
Presumably, then, the smartphone industry will struggle to breach the 90% global penetration mark until this tragic reality changes.
Source: Our World in Data
Smartphone statistics sources
Final thoughts
There you have it – 45 of the latest and greatest smartphone statistics to inform your marketing strategy this year. We hope you found them useful!
Now that you’re an expert in all-things-smartphone, why not brush up on your social media knowledge with our roundup of the latest social media stats?
